Demystifying Product-Market Fit (Part 2): Monitoring and Maintaining Product Market Fit
By Team Lean Agile Intelligence

Achieving product-market fit (PMF) is a crucial milestone for any business. It signifies that your product or service is meeting the needs and desires of your target market effectively. If you want to learn more about how to achieve product-market fit, check out part 1 of our Demystifying Product-Market Fit series here.
However, achieving PMF is not the end of the journey. It requires continuous monitoring, adaptation, and strategic decision-making to maintain and enhance the fit between your product and the market.
This article explores various aspects of monitoring PMF, including identifying drop-off points, addressing acquisition and retention problems, leveraging repeat usage, and choosing growth strategies post-PMF.
Monitoring Product Market Fit
Monitoring PMF involves identifying potential issues in your user journey, addressing acquisition and retention problems, and tracking the repeat usage rate.
- The Drop-off Points: Drop-off points refer to specific stages or moments in a user's journey where they disengage or stop interacting with a product or service. These points can be critical indicators of potential issues or challenges that must be addressed to improve the user experience and increase engagement. Identifying and understanding drop-off points is crucial for achieving product-market fit and ensuring the success of a product or service.
- In the language learning app, if users consistently drop off during a specific lesson or exercise, it could indicate a potential issue with the complexity of the content or the clarity of instructions. By identifying these drop-off points through user data analytics or user feedback, the app can make necessary adjustments to improve the user experience. For example, the app could simplify complex grammar explanations, provide additional visual aids, or offer clearer instructions to guide users through challenging exercises. Addressing these drop-off points helps enhance the user experience, increases engagement, and supports the achievement of product-market fit.
- The Acquisition and Retention Strategies: If you see a surge in one-time app downloads but very few active users, it suggests a retention problem. Conducting surveys or user interviews can help identify why users aren't returning, and strategies can be implemented to improve engagement.
- For Example: if there is a surge in one-time app downloads but a low number of active users over time, it suggests a retention problem. To understand the reasons behind this, the app can conduct surveys or user interviews to gather insights from users who haven't returned. By uncovering the specific factors contributing to low retention, such as lack of engagement, unclear progress tracking, or insufficient content updates, the app can implement strategies to improve user retention. These strategies might include personalized content recommendations, gamification elements to increase motivation or regular updates with fresh learning material. By addressing retention issues, the app can improve user engagement and increase the likelihood of achieving product-market fit.
- The Role of Repeat Usage: The role of repeat usage refers to the frequency and consistency with which users return to and engage with a product or service over time. Repeat usage is a significant indicator of product-market fit and signifies the value and satisfaction that users derive from the offering. When users find a product compelling and beneficial, they are more likely to continue using it and integrating it into their routines. Repeat usage demonstrates that the product effectively fulfills a need, provides a positive experience, and delivers ongoing value to users. It signifies that the product has achieved quality, relevance, and utility, encouraging users to choose it over alternative solutions repeatedly.
- For Example: if users consistently return and engage with the app because they appreciate its unique approach to conversational practice using advanced AI technology, it indicates a compelling value proposition. The app's emphasis on providing realistic and interactive AI-powered conversations sets it apart from competitors and resonates with the target market. This repeat usage demonstrates a strong sign of product-market fit as users find value in the unique feature and keep returning for more. The app can leverage this positive feedback by emphasizing its distinctive value proposition in marketing efforts and enhancing the conversational practice feature to maintain and expand its user base.

The Metrics to Confirm Product Market Fit
You can consider several metrics and indicators to confirm whether you have achieved Product-Market Fit (PMF). Here are some methods and examples:
Customer Acquisition Cost (CAC) vs. Customer Lifetime Value (LTV):
- Calculate the cost of acquiring new customers (CAC) and compare it to their lifetime value (LTV). If your CAC is significantly lower than the LTV, it suggests that your product is generating enough value to sustain profitability and indicates a positive PMF. For example, if your CAC is $10 and the LTV of a customer is estimated to be $100, it indicates a favorable ratio.
The 40% Rule:
- Survey a representative sample of your users and ask them if they would be "very disappointed" if they couldn't access your product. If at least 40% of the surveyed users express strong disappointment, it indicates a high likelihood of PMF. Sean Ellis has a great video that explains this approach to determining PMF.
Customer Satisfaction and Retention:
- Monitor customer satisfaction levels through surveys, feedback, and reviews. High customer satisfaction, indicated by positive ratings and testimonials, can strongly indicate PMF.
- Track customer retention rates and churn rates. If customers continue to use and engage with your product over a sustained period, it suggests that they find value in it and have integrated it into their routines.
- Another common metric for Customer Satisfaction (CSAT) is the "Net Promoter Score," or NPS for short.
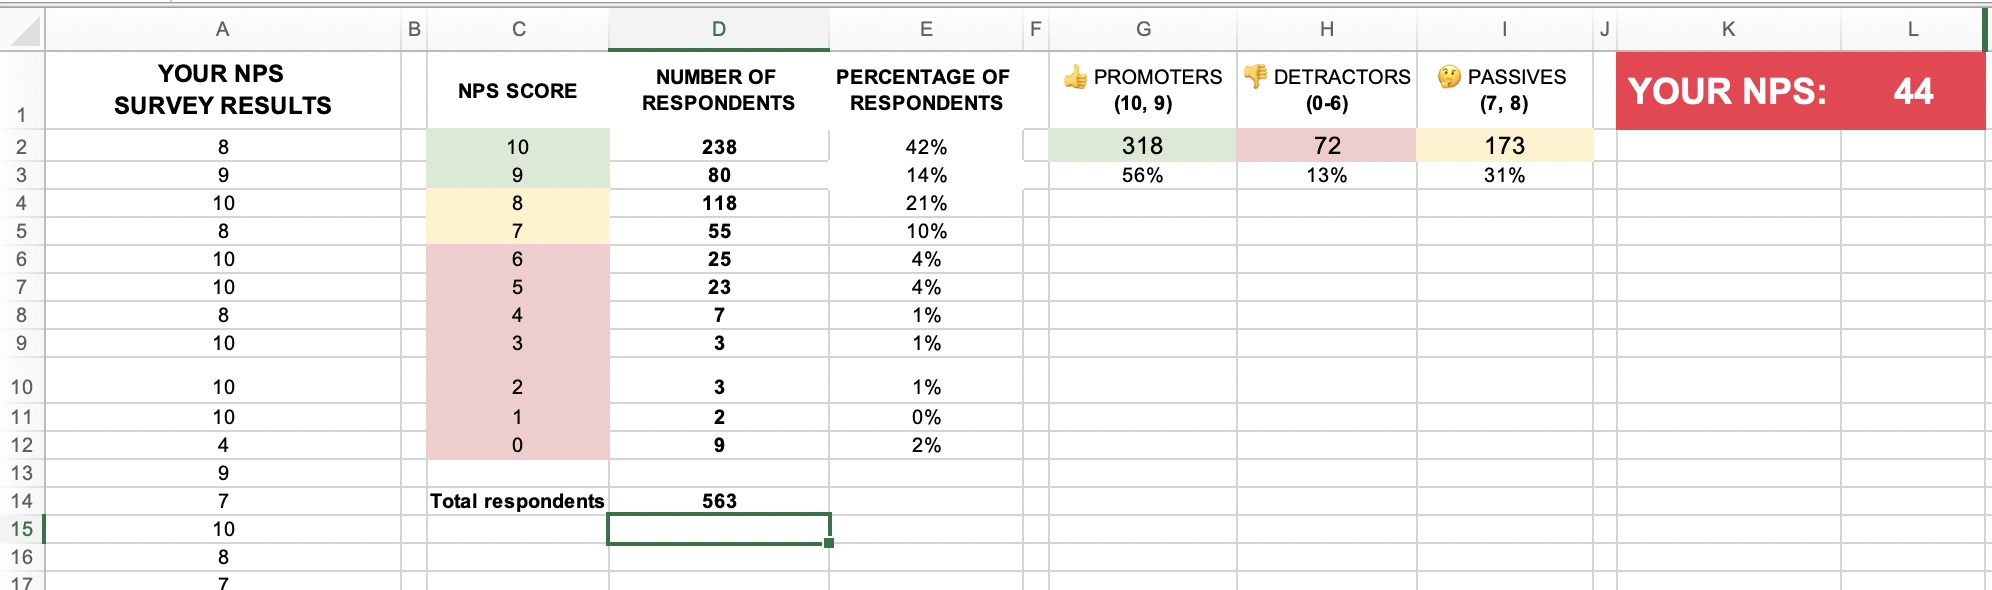
- Net Promoter Score (NPS) is widely used to measure customer satisfaction and loyalty. It provides insights into how likely your customers are to recommend your product or service to others. Here's how NPS is calculated and its interpretation:
- Survey: Conduct a customer survey using a standard NPS question: "On a scale of 0-10, how likely are you to recommend our product/service to a friend or colleague?"
- Categorize Respondents: Based on their responses, categorize customers into three groups:
- Promoters (score 9-10): These are highly satisfied and loyal customers who will likely recommend your product/service to others.
- Passives (score 7-8): These customers are satisfied but not enthusiastic enough to actively promote your product/service.
- Detractors (score 0-6): These are dissatisfied customers with negative opinions and may discourage others from using your product/service.
- Calculate NPS: Subtract the percentage of detractors from the percentage of promoters. The formula is NPS = % Promoters - % Detractors.
- Interpretation: NPS can range from -100 to +100. The score provides an indication of overall customer sentiment and loyalty toward your brand:
- NPS above 0: Generally considered positive, indicating that you have more promoters than detractors.
- NPS around 0: Suggests a neutral sentiment where the number of promoters and detractors is relatively balanced.
- NPS above 50: Indicates strong customer loyalty and advocacy, with a higher proportion of promoters.
- It's important to note that NPS should not be the sole measure of customer satisfaction but rather used with other metrics and qualitative feedback to gain a holistic understanding of customer sentiment. Regularly tracking NPS over time allows you to monitor customer satisfaction changes and identify improvement areas. NPS can be a valuable tool for assessing customer loyalty and identifying potential promoters who can contribute to organic growth and word-of-mouth marketing.
The company "HotJar" has an excellent free NPS calculator. You can find there here.
Referral and Word-of-Mouth:
- Measure the extent to which customers refer your product to others. A high rate of organic referrals and positive word-of-mouth demonstrates that your product resonates with users, who perceive it as valuable.
Usage and Engagement Metrics:
- Analyze user behavior and engagement metrics such as active users, session duration, frequency of usage, and feature adoption. If users consistently and actively engage with your product, it signals a positive PMF.
- Look for key indicators of user dependency on your product. For example, if users rely on your product to complete critical tasks, it signifies a strong product-market fit.
Market Share and Competitive Positioning:
- Assess your market share and how you compare to competitors. If you have gained a significant market share and are considered a leading player in the industry, it indicates a level of PMF.
- Look for signs of product differentiation and customer loyalty that set you apart from competitors. If users choose your product over alternatives due to unique features or benefits, it suggests a strong product-market fit.
Remember, PMF is not a binary state but a continuous journey. These metrics serve as guideposts to help you assess and refine your product-market fit. It's important to regularly track and analyze these metrics over time to adapt your strategies and offerings to better align with your target market's needs and preferences.

Maintaining Product Market Fit
The market isn't static, and neither should your product be. Regular feedback, staying updated with market trends, and continuously improving your product based on this insight are critical to maintaining PMF.
Growth Hypothesis
A growth hypothesis is an assumption or prediction about the factors that can drive the growth of your product or service. It's essentially a statement that defines the cause-and-effect relationship you believe will result in growth. Here are steps to create an effective growth hypothesis:
-
Identify your growth levers
-
User Acquisition: One growth lever for the app could be user acquisition. This involves attracting new users to download and start using the app. Strategies for user acquisition could include targeted marketing campaigns, social media advertising, search engine optimization, partnerships with educational institutions, or influencer collaborations. By increasing the number of users who discover and install the app, the potential user base expands, providing a larger audience for the app's language learning solutions.
-
User Acquisition: User activation focuses on getting users to engage with the app and experience its core features. For the AI language learning app, this could involve guiding new users through an onboarding process that introduces them to the key functionalities, such as interactive conversations with AI, vocabulary exercises, or grammar lessons. The app can employ techniques like personalized recommendations, gamification elements, or progress tracking to ensure users have a positive and engaging initial experience. By effectively activating users, the app increases the likelihood of user retention and long-term engagement.
-
User Acquisition: User retention is a growth lever that keeps users engaged and motivated to continue using the app over an extended period. Strategies for user retention could include offering personalized learning paths, sending regular progress updates and reminders, providing additional content or challenges as users advance, or implementing community features that foster interaction among learners. By fostering a sense of progress, community, and ongoing value, the app encourages users to remain active, resulting in higher retention rates.
-
User Acquisition: User monetization involves generating revenue from the app's user base. For the AI language learning app, monetization strategies could include offering subscription plans with access to premium content or advanced features, selling language proficiency certificates, or partnering with language certification programs. The app can convert active users into paying customers by providing additional value-added services or premium offerings, contributing to revenue growth.
-
User Referral:User referral leverages the existing user base to acquire new users through word-of-mouth recommendations. The AI language learning app can implement referral programs that incentivize users to invite friends or share their progress on social media platforms. By incentivizing and rewarding user referrals, the app can tap into the power of organic growth, expanding its user base by advocating for satisfied users.
-
-
The first step in developing a growth hypothesis is identifying the potential levers that can drive growth for your business. These include product features, marketing channels, customer behaviors, pricing strategies, and operational efficiencies. For instance, for the SpeakMaster app, some growth leavers might be:
-
Develop your assumption
-
Next, articulate an assumption about how the identified growth lever will impact a key business metric. For example, for the Language Learning App, some assumptions could be:
-
-
Assumption: Users will find value in realistic AI-powered conversation practice.
-
Rationale: Based on market research and user feedback, there is a demand for language learning apps that provide interactive and immersive conversation practice. Users may prefer the convenience and personalized experience offered by AI-powered conversations over traditional methods.
-
-
Assumption: Users will be motivated by real-time progress tracking.
-
Rationale: Users often seek a sense of achievement and progress when learning a new language. By offering real-time progress tracking that showcases their learning milestones, users can feel motivated and engaged, encouraging them to continue using the app.
-
-
Assumption: Personalized learning paths will enhance user engagement.
-
Rationale: Different users have unique learning styles, preferences, and proficiency levels. By tailoring learning paths to individual needs, users can have a customized language learning experience that matches their goals and abilities, potentially increasing their engagement and satisfaction.
-
-
Assumption: Gamification elements will incentivize user participation.
-
Rationale: Incorporating gamification elements, such as points, badges, leaderboards, or challenges, can make the language learning experience more enjoyable and motivating. By gamifying certain aspects of the app, users may be incentivized to actively participate, complete tasks, and compete with others, thus increasing their engagement and time spent on the app.
-
-
Assumption: Social interaction features will enhance user retention.
-
Rationale: Language learning often benefits from social interaction and community support. By integrating features that allow users to connect with fellow learners, engage in language exchange, or receive feedback from native speakers, the app can create a sense of belonging and foster a supportive learning environment, potentially leading to higher user retention.
These assumptions provide a starting point for developing and shaping the AI language learning app. The app can gather data to validate or refine these assumptions through user research, surveys, and feedback, ensuring the product aligns with users' needs and preferences. The iterative assumption development and validation process allows the app to evolve and improve based on real user insights, increasing the chances of achieving product-market fit and delivering a valuable language learning experience.
-
-
-
Define your metrics
-
User Acquisition: This KPI measures the number of new users or customers acquired within a specific period. It's often used when the hypothesis is about attracting new users or customers
-
Conversion Rate: This KPI measures the percentage of users who complete a desired action (e.g., signing up for a newsletter, purchasing, upgrading to a paid plan). It's often used when the hypothesis is about converting users from one stage of the customer journey to the next.
-
Average Revenue per User (ARPU): This KPI measures the revenue generated per user or customer. It's often used when the hypothesis is about increasing revenue or profitability.
-
Customer Lifetime Value (CLV): This KPI measures the total revenue a business can reasonably expect from a single customer account. It's often used when the hypothesis is about increasing the value derived from existing customers.
-
Customer Retention Rate: This KPI measures the proportion of retained customers over time. It's often used when the hypothesis is about reducing customer churn.
-
Net Promoter Score (NPS): This KPI measures customer loyalty and is often used when the hypothesis is about improving customer satisfaction or loyalty.
-
Churn Rate: This KPI measures the number of customers who leave a product over a given period. It's typically used when the hypothesis is about reducing customer churn or increasing customer retention.
-
-
Determine how you will measure the outcome of your hypothesis. This should be a key performance indicator (KPI) related to your business goal. In the fitness app example, it could be the number of app downloads.
-
Here are some examples of Key Performance Indicators (KPIs) that might be relevant to a growth hypothesis:
Remember, the choice of KPI should be closely related to the specific growth lever you focus on in your hypothesis. The KPI should provide a measurable outcome to validate or disprove your hypothesis.
-
Experiment and Analyze the Results
-
Run an experiment to test your hypothesis. This could involve releasing the new feature to a small segment of your user base and tracking the impact on app downloads. After running the experiment for a sufficient time, analyze the data to see if it supports your hypothesis. Did our ideas prove or disprove our hypothesis? Using the SpeakMaster language app as an example:
-
Experiment: Hypothesis - Users will have higher engagement and retention if the app introduces a daily streak feature that rewards consistent practice.
-
Implementation: The SpeakMaster app introduces a daily streak feature that tracks the number of consecutive days a user engages in language learning activities.
-
Measurement: Monitor user engagement metrics, such as the number of active users, session durations, and completion rates, before and after implementing the daily streak feature.
-
Analysis: Compare the engagement and retention metrics of users who participate in the daily streak feature with those who don't. Analyze whether users who maintain longer streaks show higher engagement levels and are likelier to continue using the app.
-
-
Experiment: Hypothesis - Users will perceive higher value and satisfaction if the app offers personalized vocabulary quizzes based on their learning progress and interests.
-
Implementation: The SpeakMaster app introduces a personalized vocabulary quiz feature that tailors quiz questions to each user's proficiency level, learning goals, and preferred topics.
-
Measurement: Conduct user surveys or feedback analysis to assess user satisfaction, perceived value, and enjoyment of the personalized vocabulary quizzes. Measure user ratings, feedback comments, and completion rates for the quizzes.
-
Analysis: Analyze user feedback to understand whether the personalized quizzes enhance user satisfaction and perceived value. Assess whether users who engage in the quizzes show higher satisfaction levels and exhibit longer-term retention.
-
-
Experiment: Hypothesis - Users will be more motivated to learn if the app incorporates social learning challenges where users can compete and collaborate.
-
Implementation: The SpeakMaster app introduces social learning challenges where users can participate in language-related competitions, group activities, or collaborative tasks.
-
Measurement: Track user participation rates, completion rates, and social interactions within the challenges. Monitor user feedback, ratings, and community engagement related to the social learning challenges.
-
Analysis: Evaluate the impact of the social learning challenges on user motivation and engagement. Analyze whether users actively participating in the challenges exhibit higher motivation levels, increased user interactions, and improved learning outcomes.
-
-
-
Refine Growth Hypothesis
-
Based on your analysis, refine your growth hypothesis. Using SpeakMaster as an example:
-
Original Growth Hypothesis: Users will have higher engagement and retention if the app introduces a daily streak feature that rewards consistent practice.
-
Experiment: The SpeakMaster app implements the daily streak feature and tracks user engagement and retention metrics before and after its introduction.
-
Experiment Results: Contrary to the initial assumption, the results indicate that the daily streak feature did not significantly increase user engagement or retention. Users responded little to the streak feature, and the overall impact on their long-term usage was minimal.
-
-
Refined Growth Hypothesis: Users will have higher engagement and retention if the app introduces a personalized learning path that adapts to their progress and provides tailored recommendations.
Remember, the goal of a growth hypothesis is not just to be proven right but to learn more about what drives growth for your business. The insights you gain from this process can be incredibly valuable in informing your product development and marketing strategies.
-
-

Growth Strategies Post Product Market Fit
Achieving PMF is just the first part of the puzzle. The next step involves choosing the appropriate growth strategy based on your product and market understanding. Let's use previous Apple releases as examples this time for a common understanding.
Market Penetration Strategy
Here, you aim to increase your market share with your existing product in the existing market.
Apple example: Apple has often employed this strategy by increasing the market share of its existing products. For example, consider their yearly release cycle for the iPhone. Each new generation of the iPhone doesn't drastically change the core product but adds incremental improvements or new features like better cameras, faster processors, or design changes. These enhancements increase their market share within the existing smartphone market by enticing customers to upgrade and attracting new customers.
Product Development Strategy
This involves developing new products for your existing market.
Apple example: Apple's release of the iPad in 2010 serves as a great example of a product development strategy. At the time, Apple had a strong foothold in the mobile and personal computing market with the iPhone and MacBook lines. With the iPad, they developed a new product that blended a smartphone and laptop to offer to their existing customer base. This represented a new product for the existing market they had already captured.
Market Development Strategy
Market development strategy entails finding new markets for your existing product.
Apple example: Apple used this strategy when it expanded the iPhone to China in 2009. They had a well-established iPhone product and were entering a new market where the product was not yet available. This move allowed them to significantly grow their user base by making their existing product available to a new market.
Diversification Strategy
This riskiest strategy involves introducing new products in an entirely new market. A food processing company starting a line of fitness equipment for a health-conscious market illustrates diversification.
Apple example: A good example of Apple using a diversification strategy is the introduction of the Apple Watch and the broader Apple Health platform. This was a move into a new market (health and wellness tech) with a new product line. It was a risky move because it was a departure from Apple's existing product range and targeted a new set of customers focused on health and fitness. However, it has proven successful, positioning Apple as a significant health and wellness tech player.
Identifying Product Goals
Before choosing a growth strategy, identify your product goals. Are you looking to tap into a new market, or do you want to strengthen your position in the current one? These considerations guide your strategic decision-making process.
FAQs
-
What is Product Market Fit? Product Market Fit is a point at which your product's capabilities align with the needs and wants of your target market.
-
Why is maintaining Product Market Fit crucial? Maintaining PMF is essential as the market needs to evolve. Your product must continually innovate and adapt to stay relevant and valuable to users.
-
How do you know if you've achieved Product Market Fit? One simple way to start is If your Customer Acquisition Cost is lower than the Lifetime Value of your customer and at least 40% of your surveyed users would be very disappointed without your product, you've likely achieved PMF.
-
What are the growth strategies post Product Market Fit? Post-PMF growth strategies include Market Penetration, Product Development, and Diversification Strategy.
-
What role do product goals play in choosing a growth strategy? Product goals help determine which growth strategy best aligns with your objectives. You might opt for market penetration, product development, market development, or diversification, depending on your goals.