New Results Dashboards, Widgets, and Drilldowns! Oh my!

A total of 2 new Dashboards, 8 new Widgets, and 3 new Drilldowns are now available to help gather insights and decide on the next key initiatives to pursue! Navigate to the Results page to see them for yourself!
Starting with our flagship Insights Canvas Dashboard, there are 5 new Widgets:
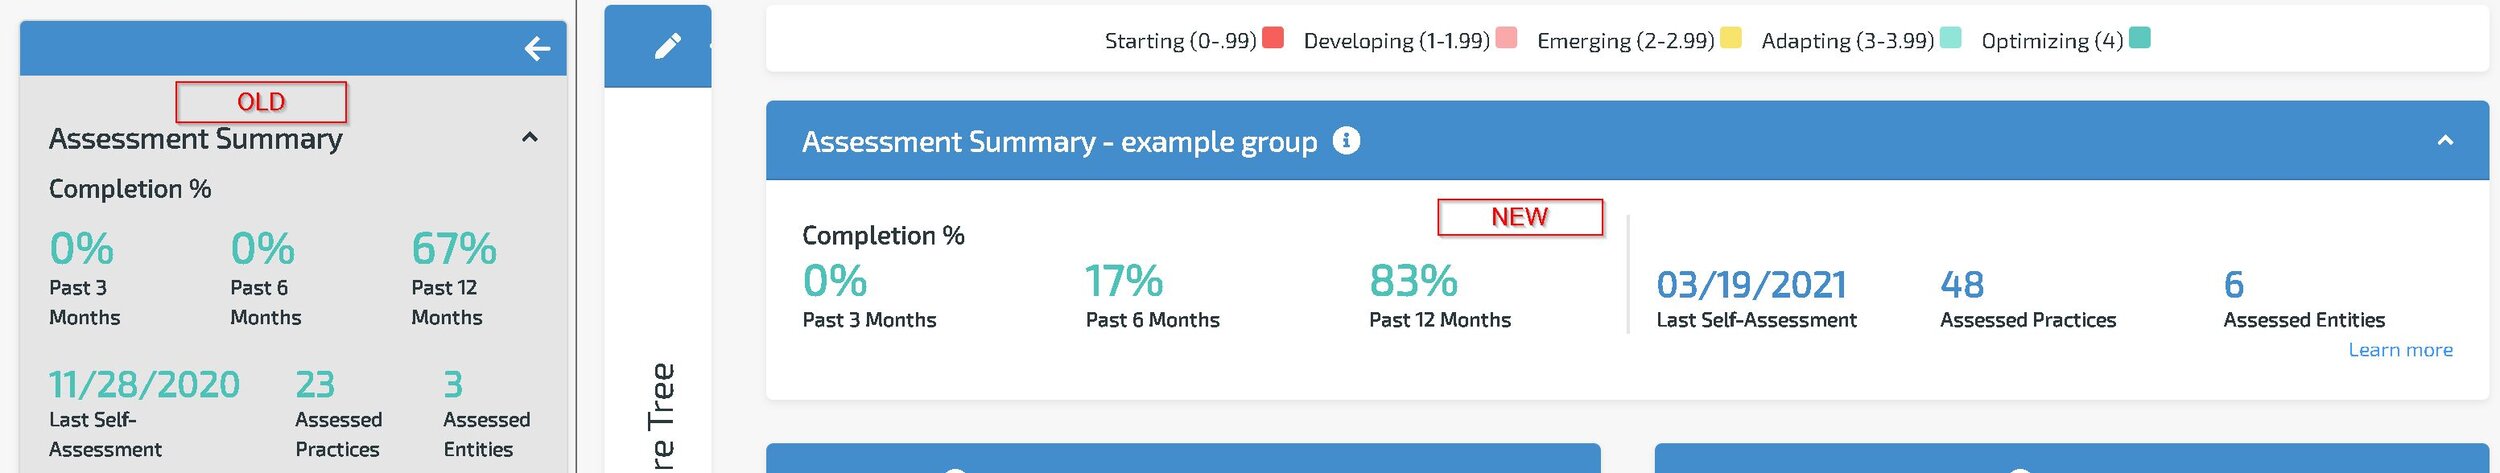
Assessment Summary - we received feedback that the old Assessment Summary was difficult to find, so we’ve made it easier to find by placing it at the top of the Insights Canvas. Quickly view key metrics about the assessments.
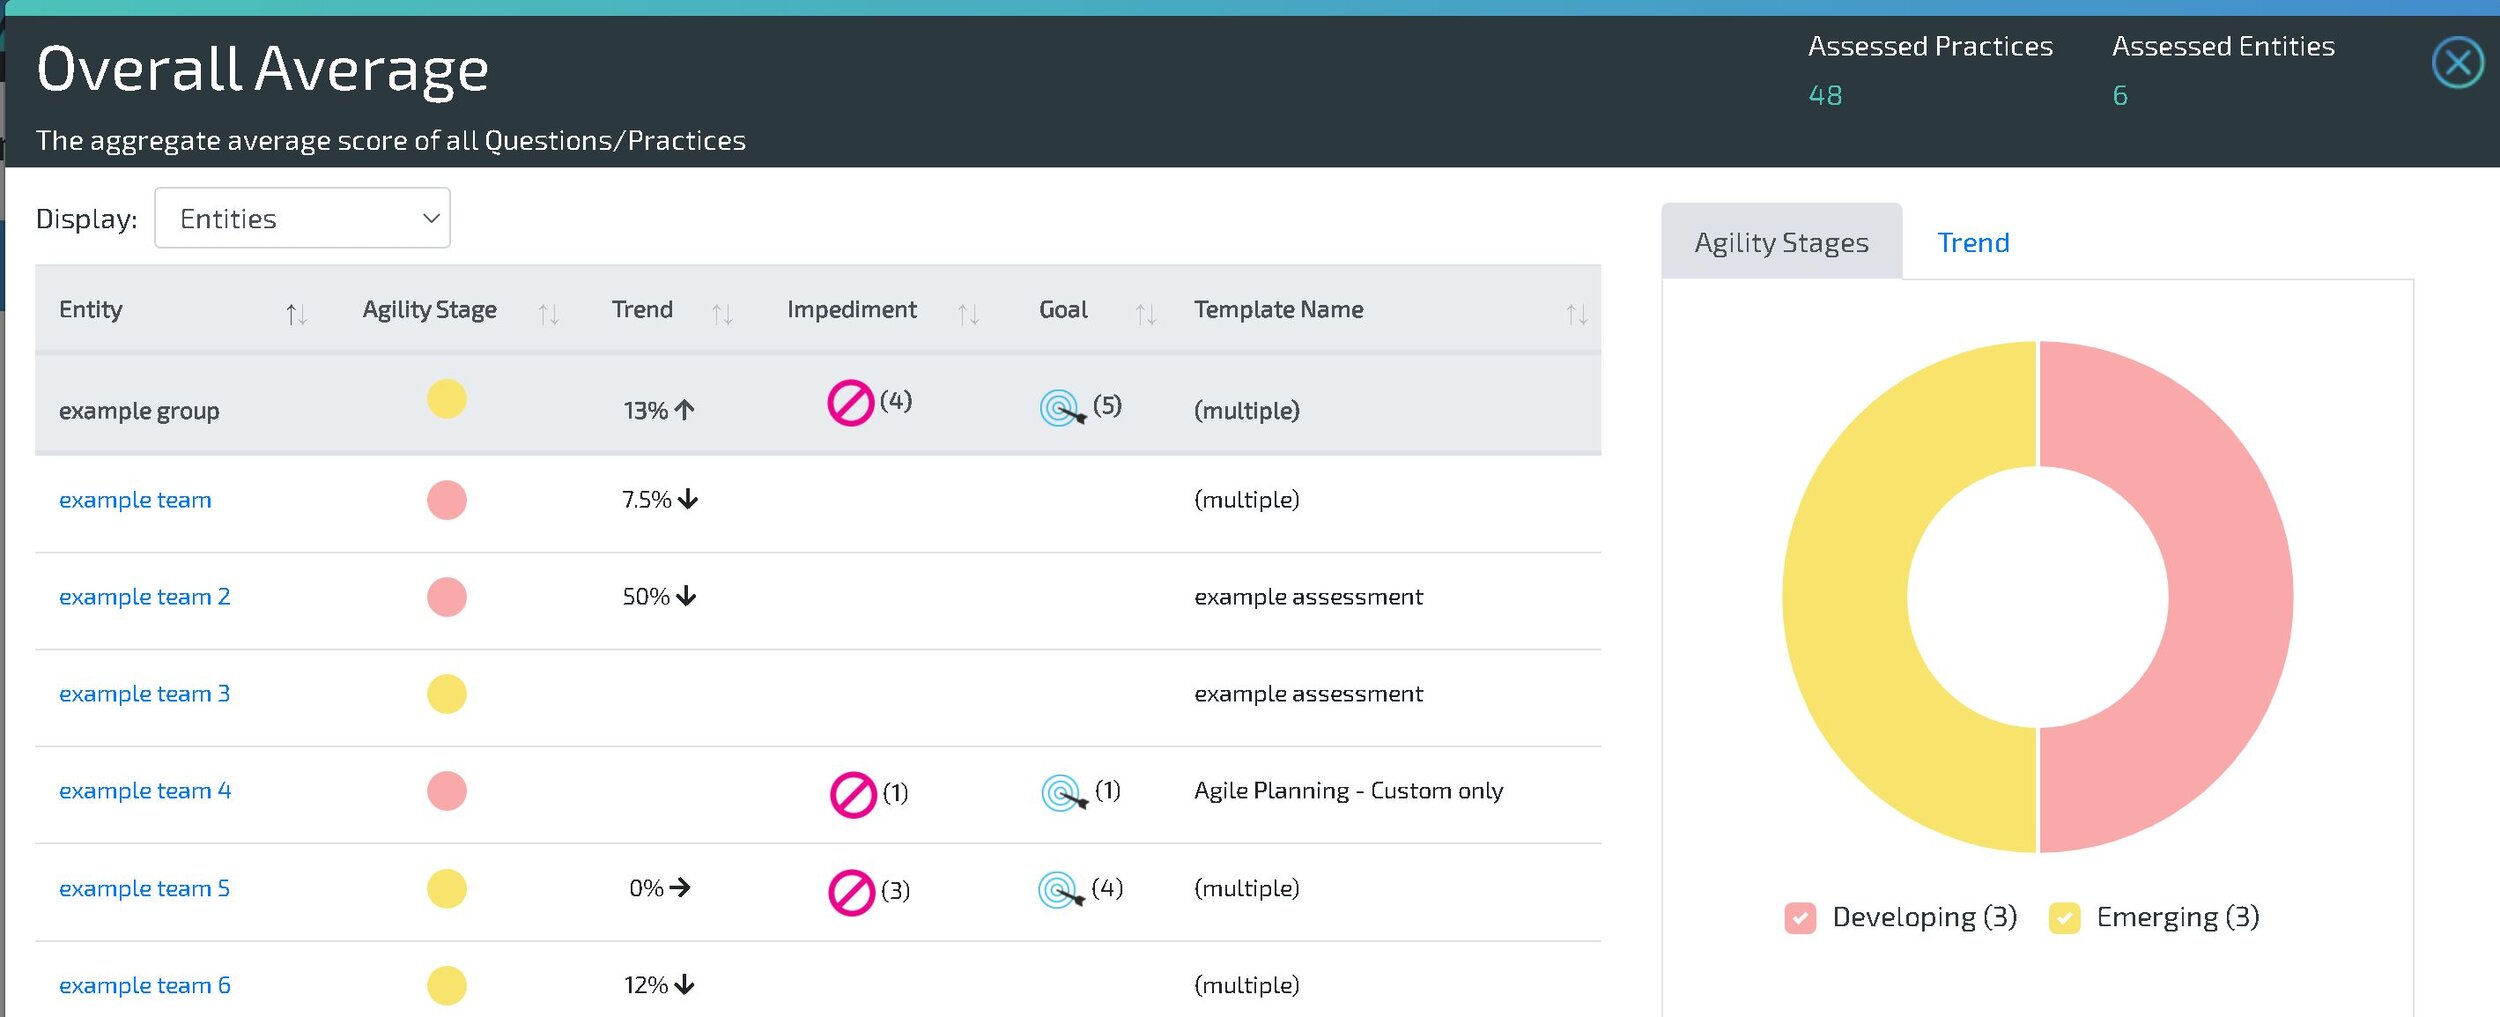
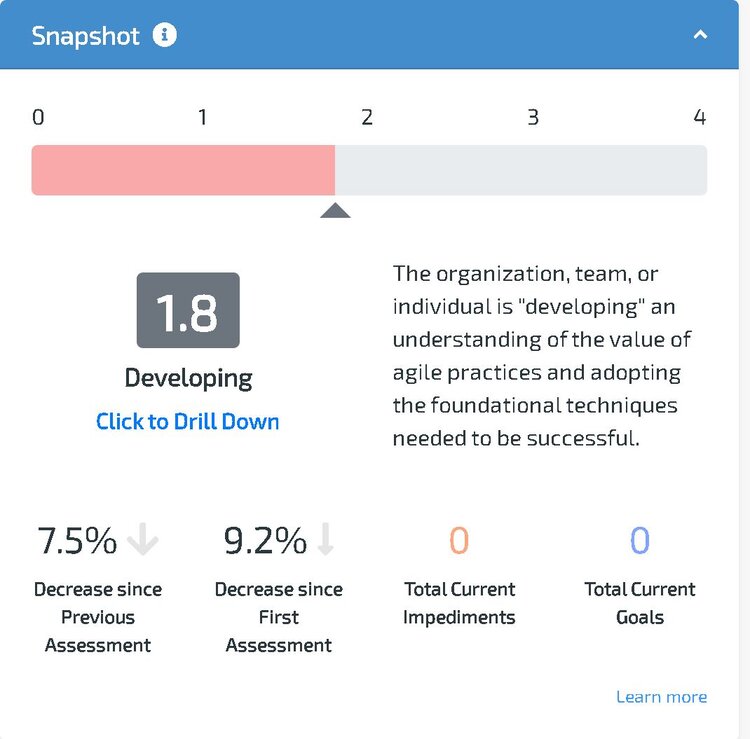 Snapshot - previously called Overall Average, this widget used to only show your Overall Average score. We have now enhanced it with an Agility Stage definition, improvement percentages, and total Goal and Impediment Counts. This is a great way to get a quick overview of how an Entity or Group is performing. And you can click to drill down into the overall average data! Snapshot - previously called Overall Average, this widget used to only show your Overall Average score. We have now enhanced it with an Agility Stage definition, improvement percentages, and total Goal and Impediment Counts. This is a great way to get a quick overview of how an Entity or Group is performing. And you can click to drill down into the overall average data! |
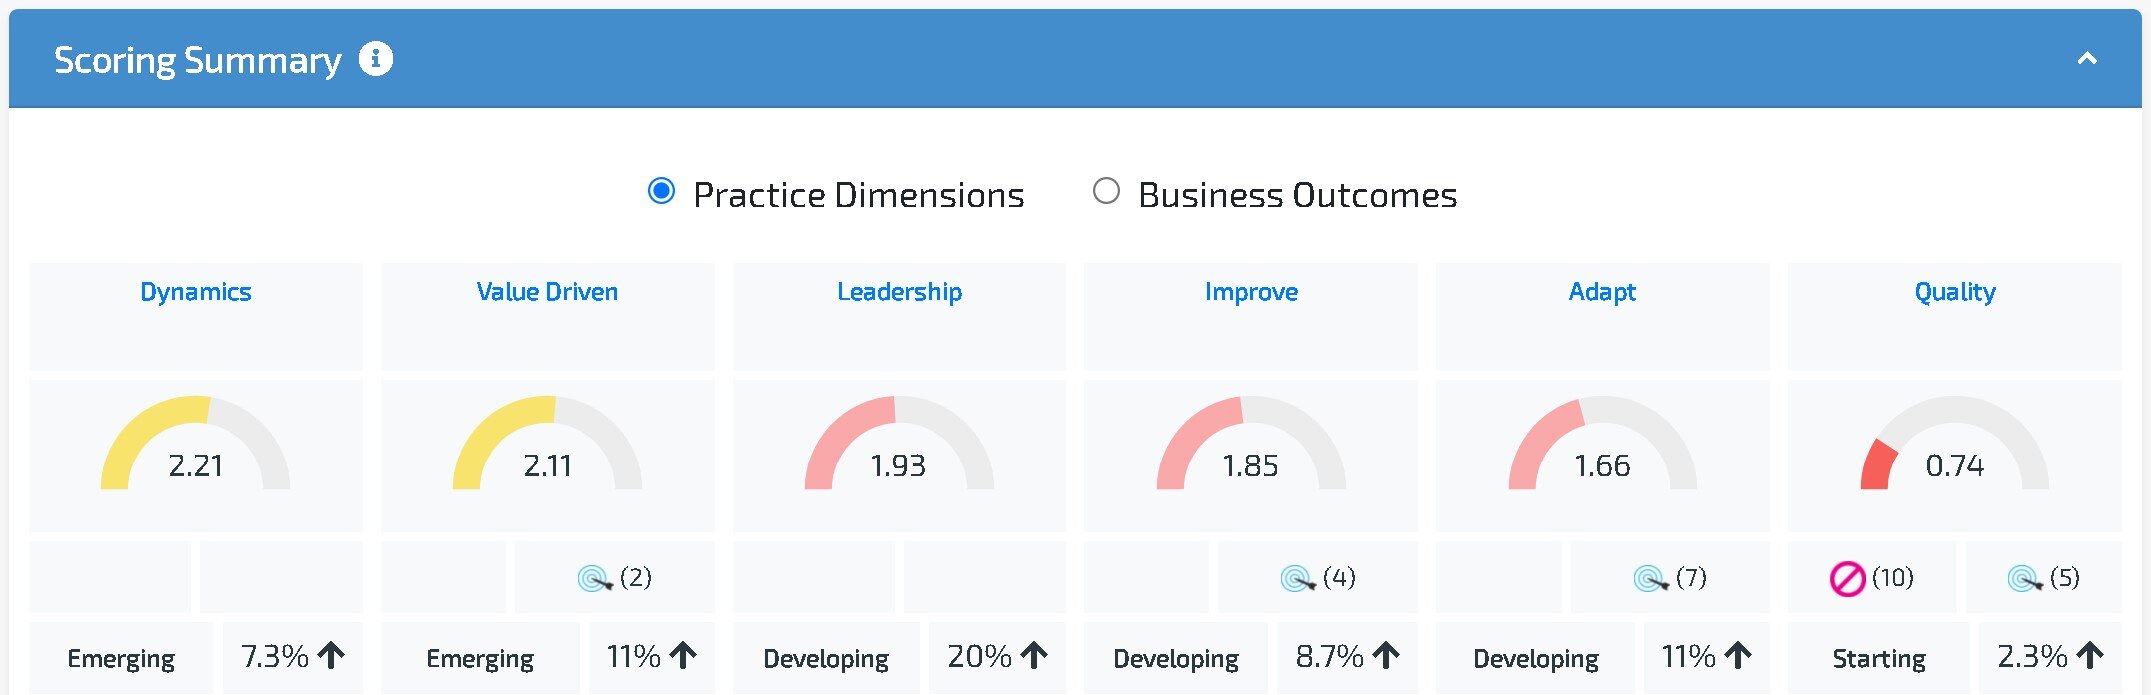 Scoring Summary - previously called Business Outcome Impacts, this widget has been enhanced with goal and impediment counts for each Business Outcome. Also, we’ve added Practice Dimensions - brand new data that we have never exposed before! And you can drill down by clicking any Business Outcome or Practice Dimension name to get more juicy details! Scoring Summary - previously called Business Outcome Impacts, this widget has been enhanced with goal and impediment counts for each Business Outcome. Also, we’ve added Practice Dimensions - brand new data that we have never exposed before! And you can drill down by clicking any Business Outcome or Practice Dimension name to get more juicy details! |
|
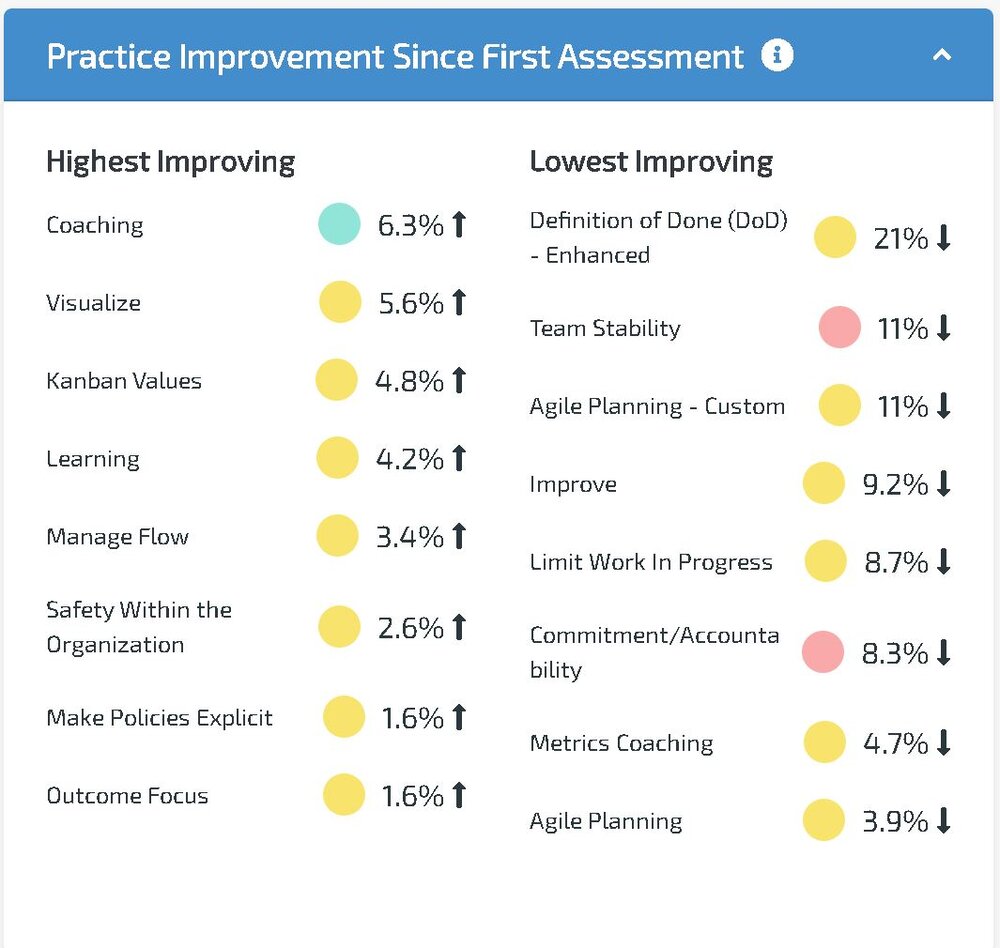 Practice Improvement Since First Assessment - this new widget provides you with the Practices that an Entity or Group has improved the most and improved the least since the First Assessment, allowing you to measure if you’ve made the progress you’ve expected and what still needs work.
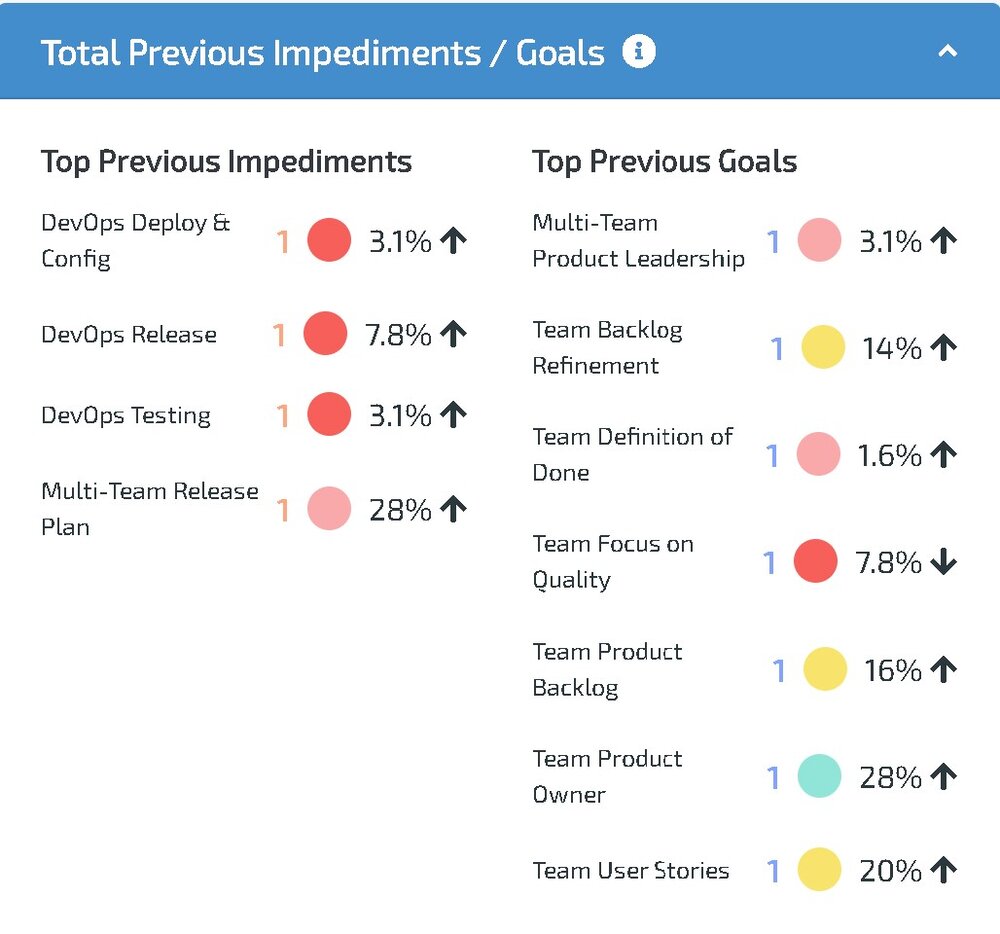 Total Previous Impediments / Goals - this new widget shows all the Practices that were marked as an Impediment or Goal as of the previous assessment. In addition, it shows the improvement that has been made since the previous assessment, allowing you to see if you have made measurable progress on your goals and impediments! Total Previous Impediments / Goals - this new widget shows all the Practices that were marked as an Impediment or Goal as of the previous assessment. In addition, it shows the improvement that has been made since the previous assessment, allowing you to see if you have made measurable progress on your goals and impediments! |
We have 2 brand new dashboards that are home to our other 3 new widgets!
Group Summary
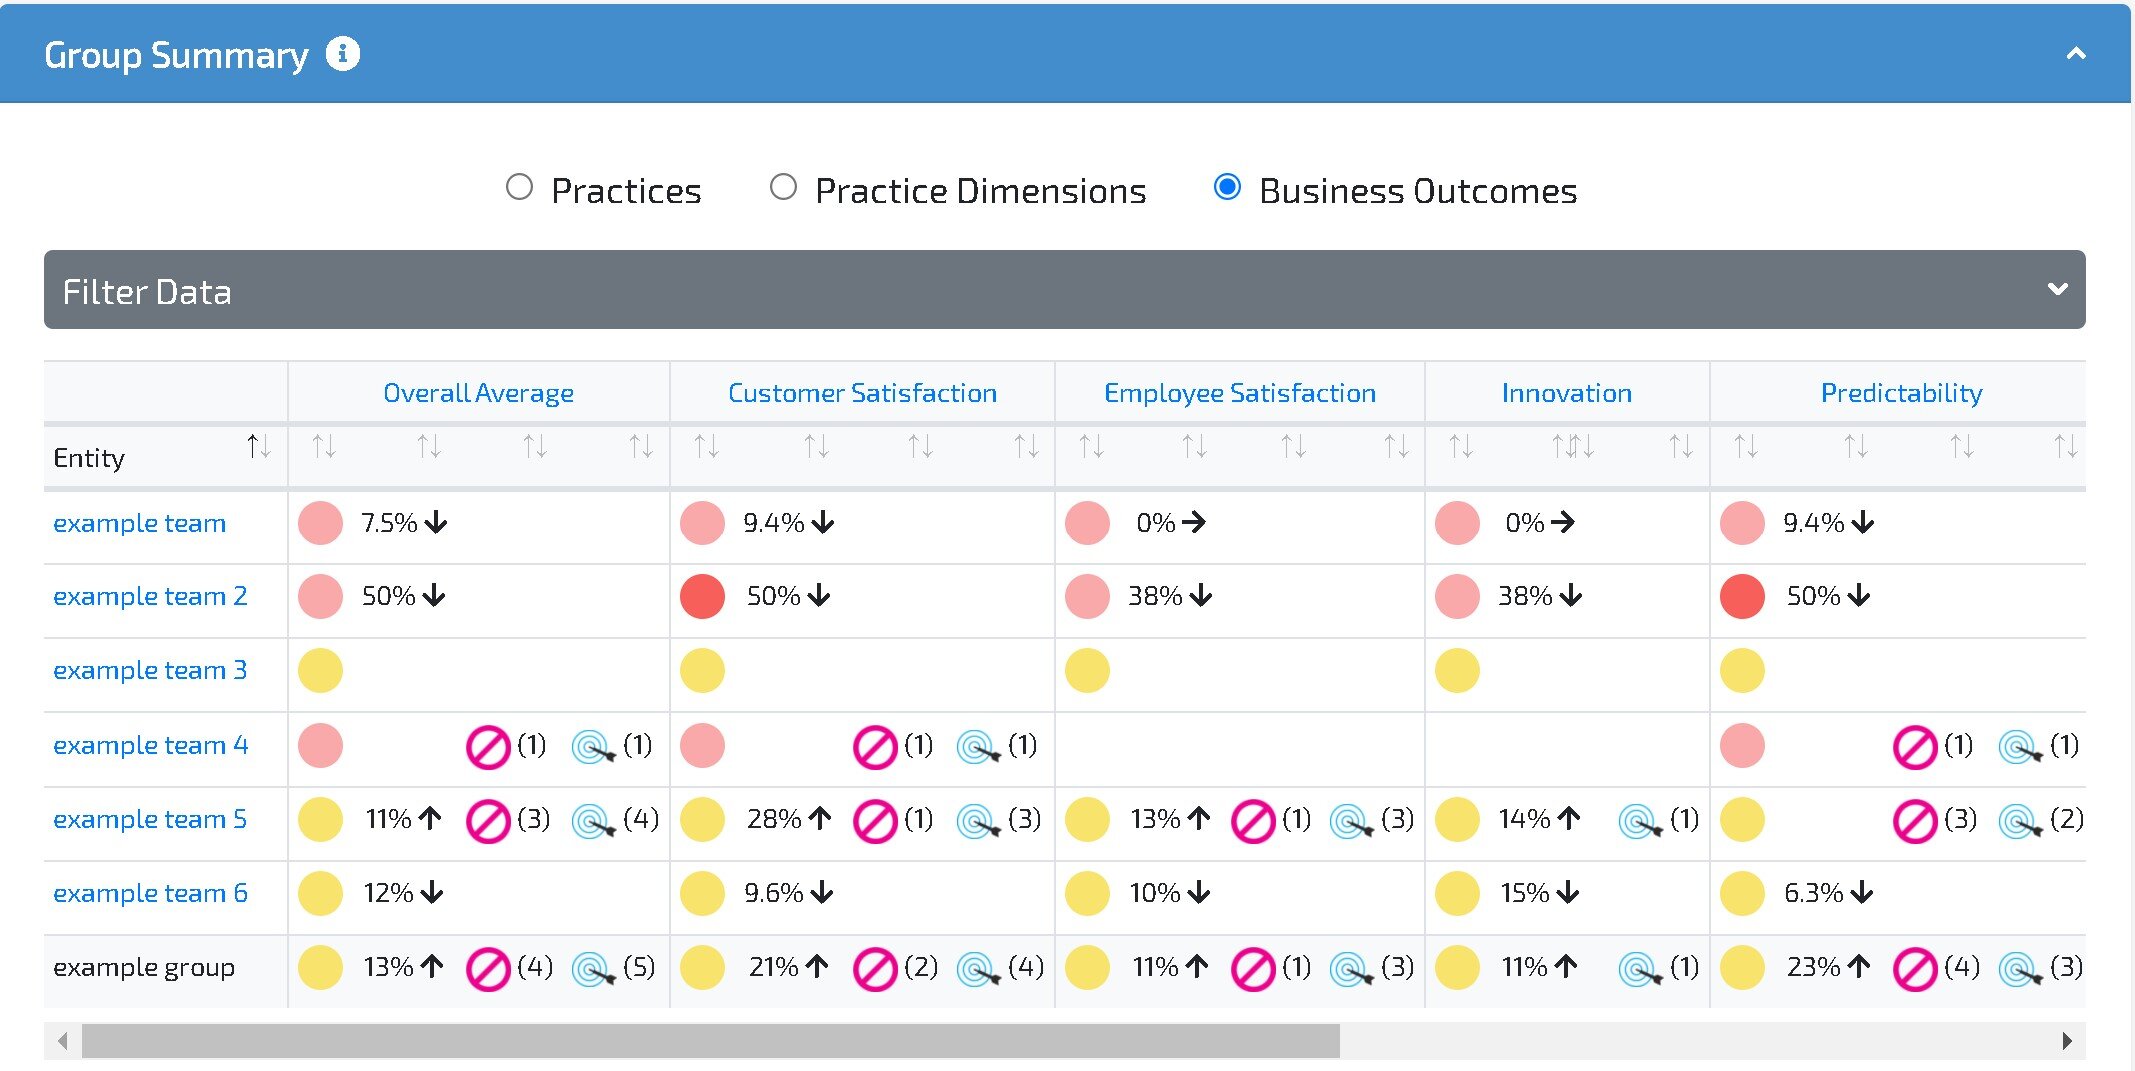
This new dashboard is designed to be a replacement of our now-retired Analytics dashboard. It combines the pattern-matching abilities by Practice and Business Outcome with extra pieces of data. The great thing about the new Group Summary widget is its versatility!
It has the power to view Results by Practice, Business Outcome, or Practice Dimension and secondary data shows Agility Stage, Trend, Variability, Impediments, and Goals. In addition, you can hide/show any details that are not important to you - allowing you to visually view as much data as possible and see the patterns across your Organization!
Trends
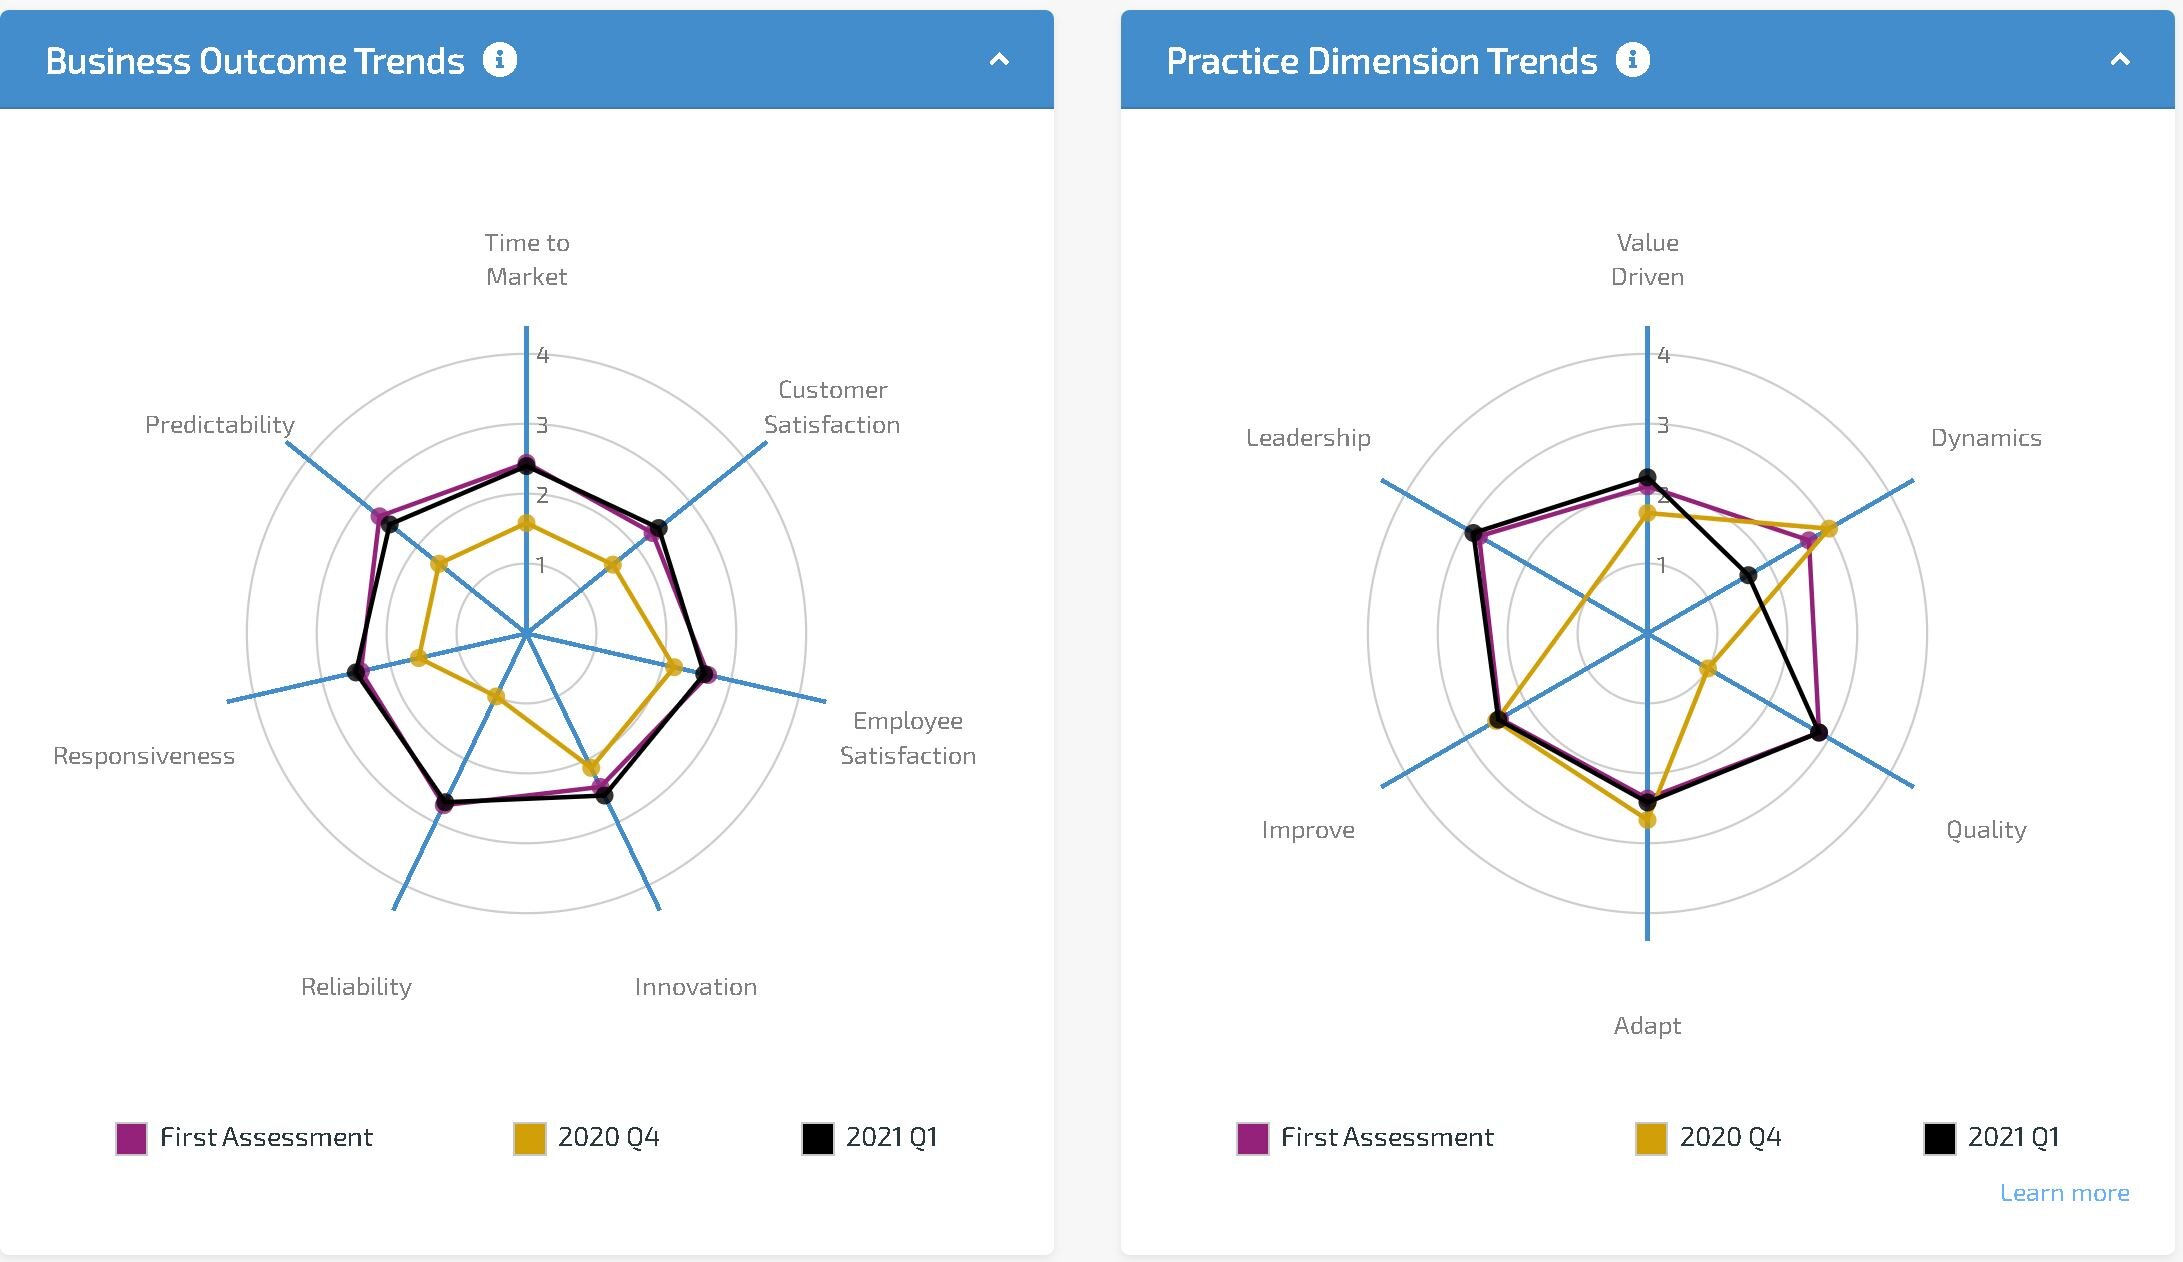
Simply a shifting of Business Outcome Trends from our now-retired Analytics dashboard, we have also added a Practice Dimension Trends. This new dashboard allows you to visually see all your trends by Business Outcome and Practice Dimension and their improvement over time.
Drilldowns
There are a total of 3 new Drilldowns in LAI to accompany the existing Practice Drilldown - Overall Average Drilldown, Business Outcome Drilldown, and Practice Dimension Drilldown. These can be accessed by clicking the hyperlinks in Snapshot, Scoring Summary, or Group Summary. They all have a similar look and feel - the intention is to have quick access to static information like the definition, but also to get breakdowns and see which Entities are contributing to your score.