Transform Your Data Analysis and Elevate Your Decision-Making with Our New Features
We are thrilled to introduce a range of new features designed to provide you with greater control, clarity, and compliance in managing your assessments. These updates are tailored to enhance your decision-making process and ensure you get the most out of our platform.
Discover what’s new and how these enhancements can transform your decision-making experience.
📊 Custom Time Periods
We understand that every organization and team has unique needs when it comes to data visualization. That’s why we’re excited to introduce Custom Time Periods in LAI. With this new feature, you can now see your data trends displayed according to the time periods that matter most to you. Whether it's rating trends, capability trends, or custom metrics, align your data with your team’s specific needs for clearer decision-making.
Key Benefits
- Personalized Data Views: Customize your data trends to match your team’s schedules, whether they are weekly, bi-weekly, or any other cadence.
- Enhanced Decision Making: Analyze performance more effectively with data trends aligned to your specific time frames, making informed decisions easier.
- Comprehensive Insight: Apply custom time periods across Results dashboards and drilldowns, ensuring that every piece of data is relevant and timely.
How It Works
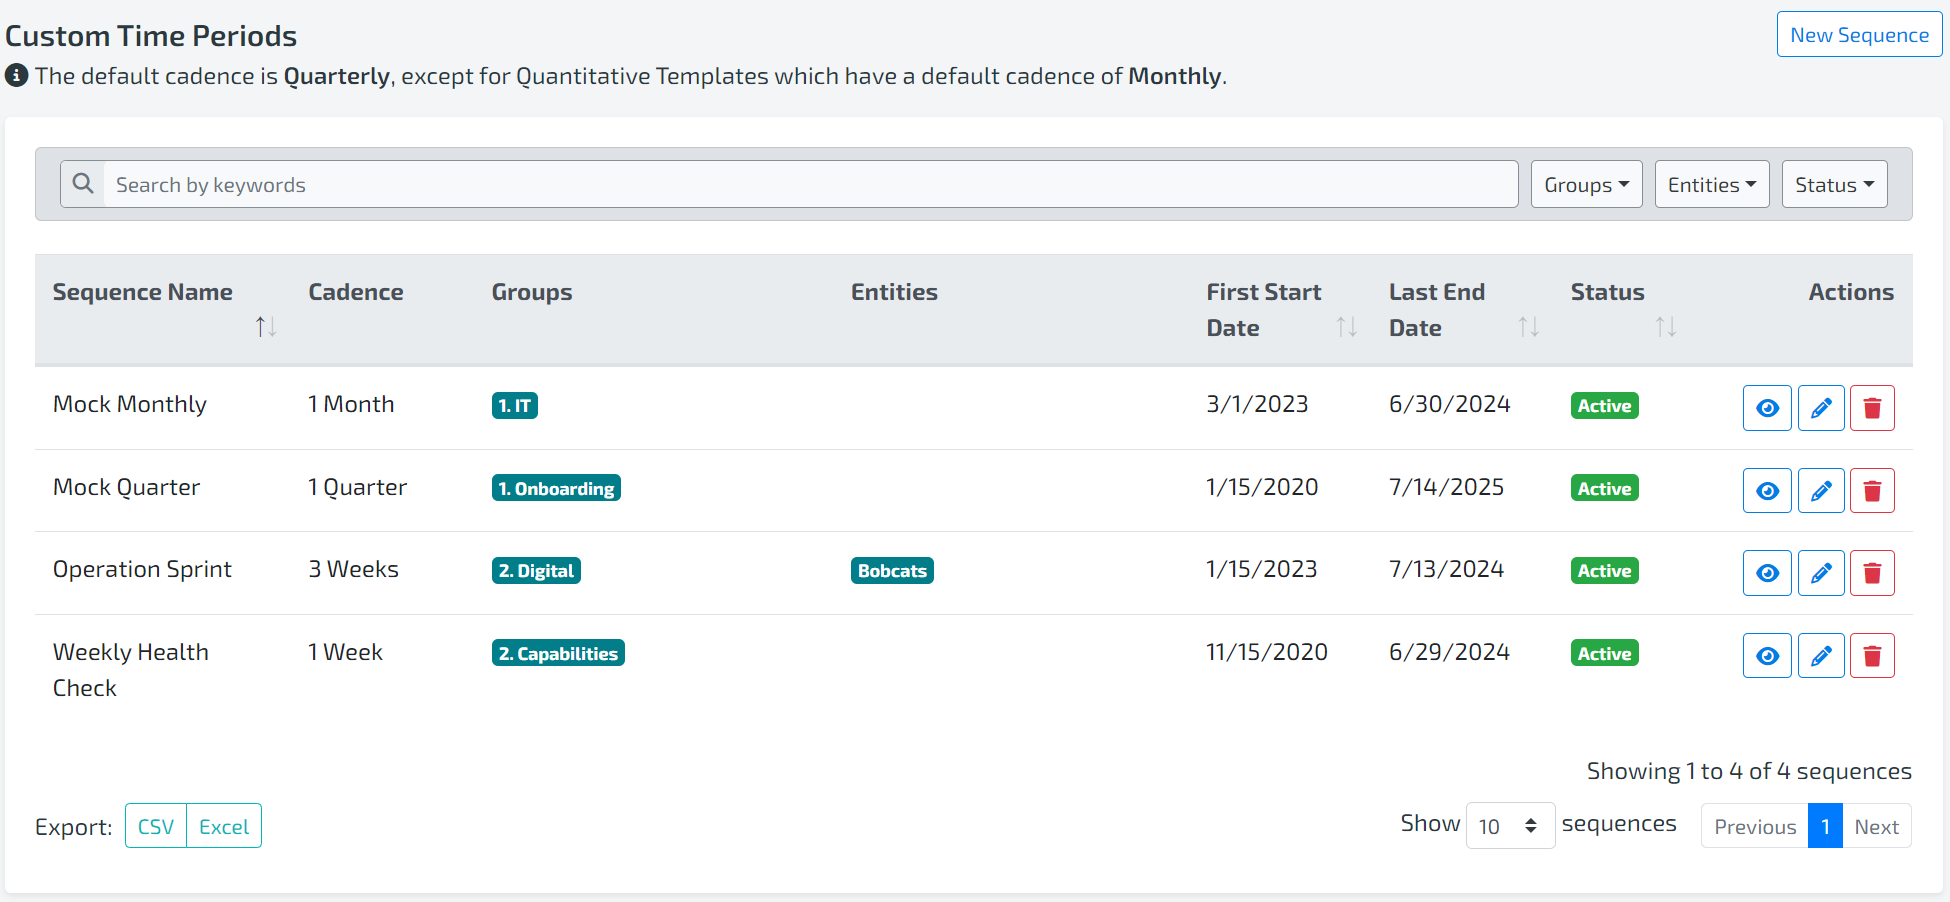
- Set Up Custom Time Periods: Navigate to the Custom Time Periods screen and create a New Sequence. Enter the necessary details, generate, and adjust time periods as needed.
- View Custom Time Periods: Access the Custom Time Periods table to view sequence details, including names, groups, entities, start and end dates, and status (Active or Expired).
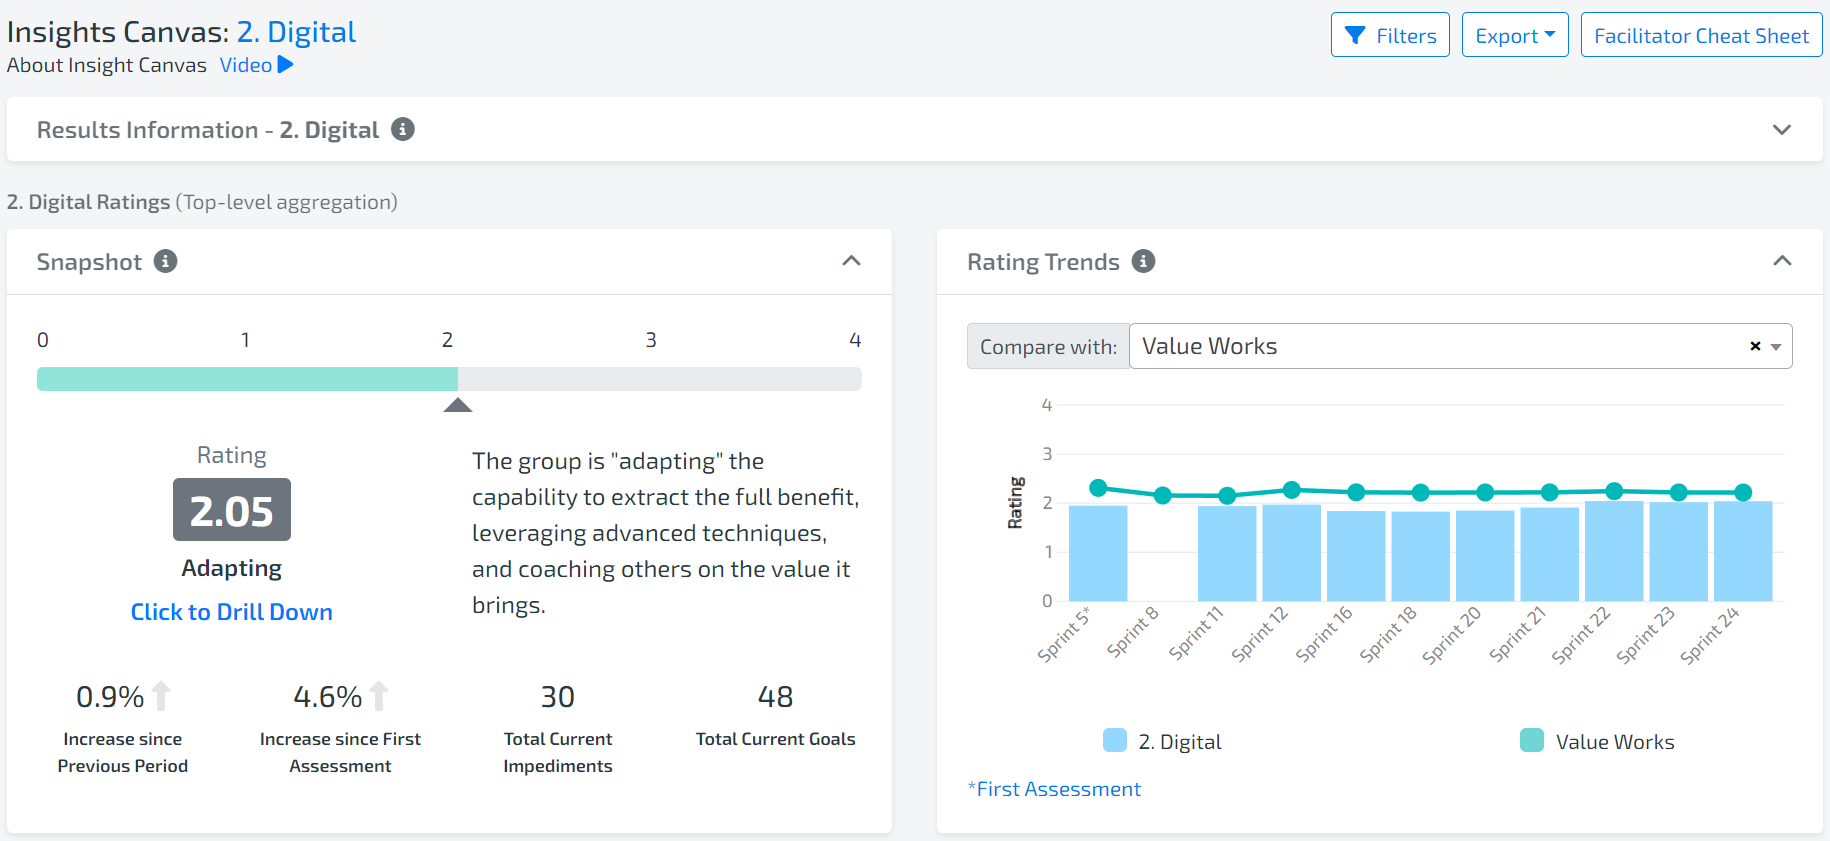
- Apply to Results Screen: View the group or entity with your new custom time periods applied, and see them reflected across the Insights Canvas and Trends dashboard. They influence Rating Trends, Capability Trends, Custom Metrics, Outcome Trends, and Dimension Trends. Gain clearer insights tailored to the specific time frames that matter most to you.
Want to save time and enhance reporting with customized, relevant data that supports strategic planning and decision-making? Check out the documentation and video for custom time periods here.
📝 Get The Results Information You Truly Need
We’ve made significant changes to how the Assessment Information widget is displayed, offering you more clarity and insight:
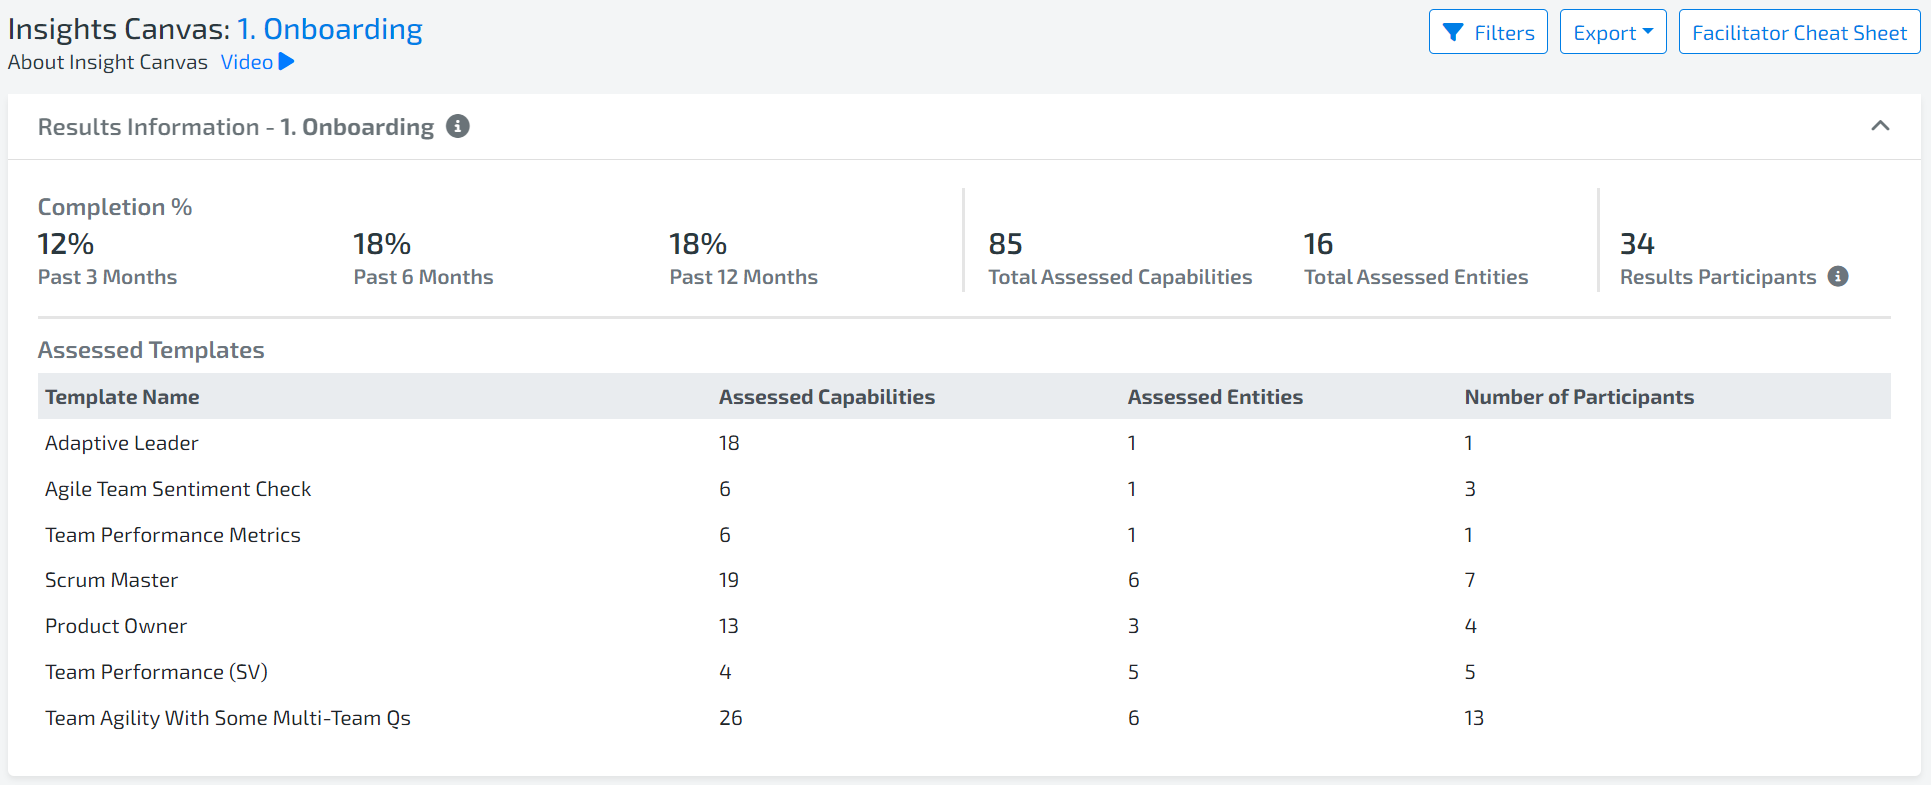
- Results Information: Formerly known as Assessment Information, this section now provides a clearer breakdown of data used to calculate your results.
- New Participant Count: Easily see the total number of participants contributing to the data on the Results page.
- New Assessed Template Table: View all assessment templates and their associated information directly on the Results page, even if you do not have access to the Manage Assessments screen. This feature is particularly beneficial for users with Analyst permissions.
These enhancements allow you to export this information as a PDF, making reporting and sharing insights more efficient. Check out the documentation here.
🔍 Get Your Capability Trends Where It Matters
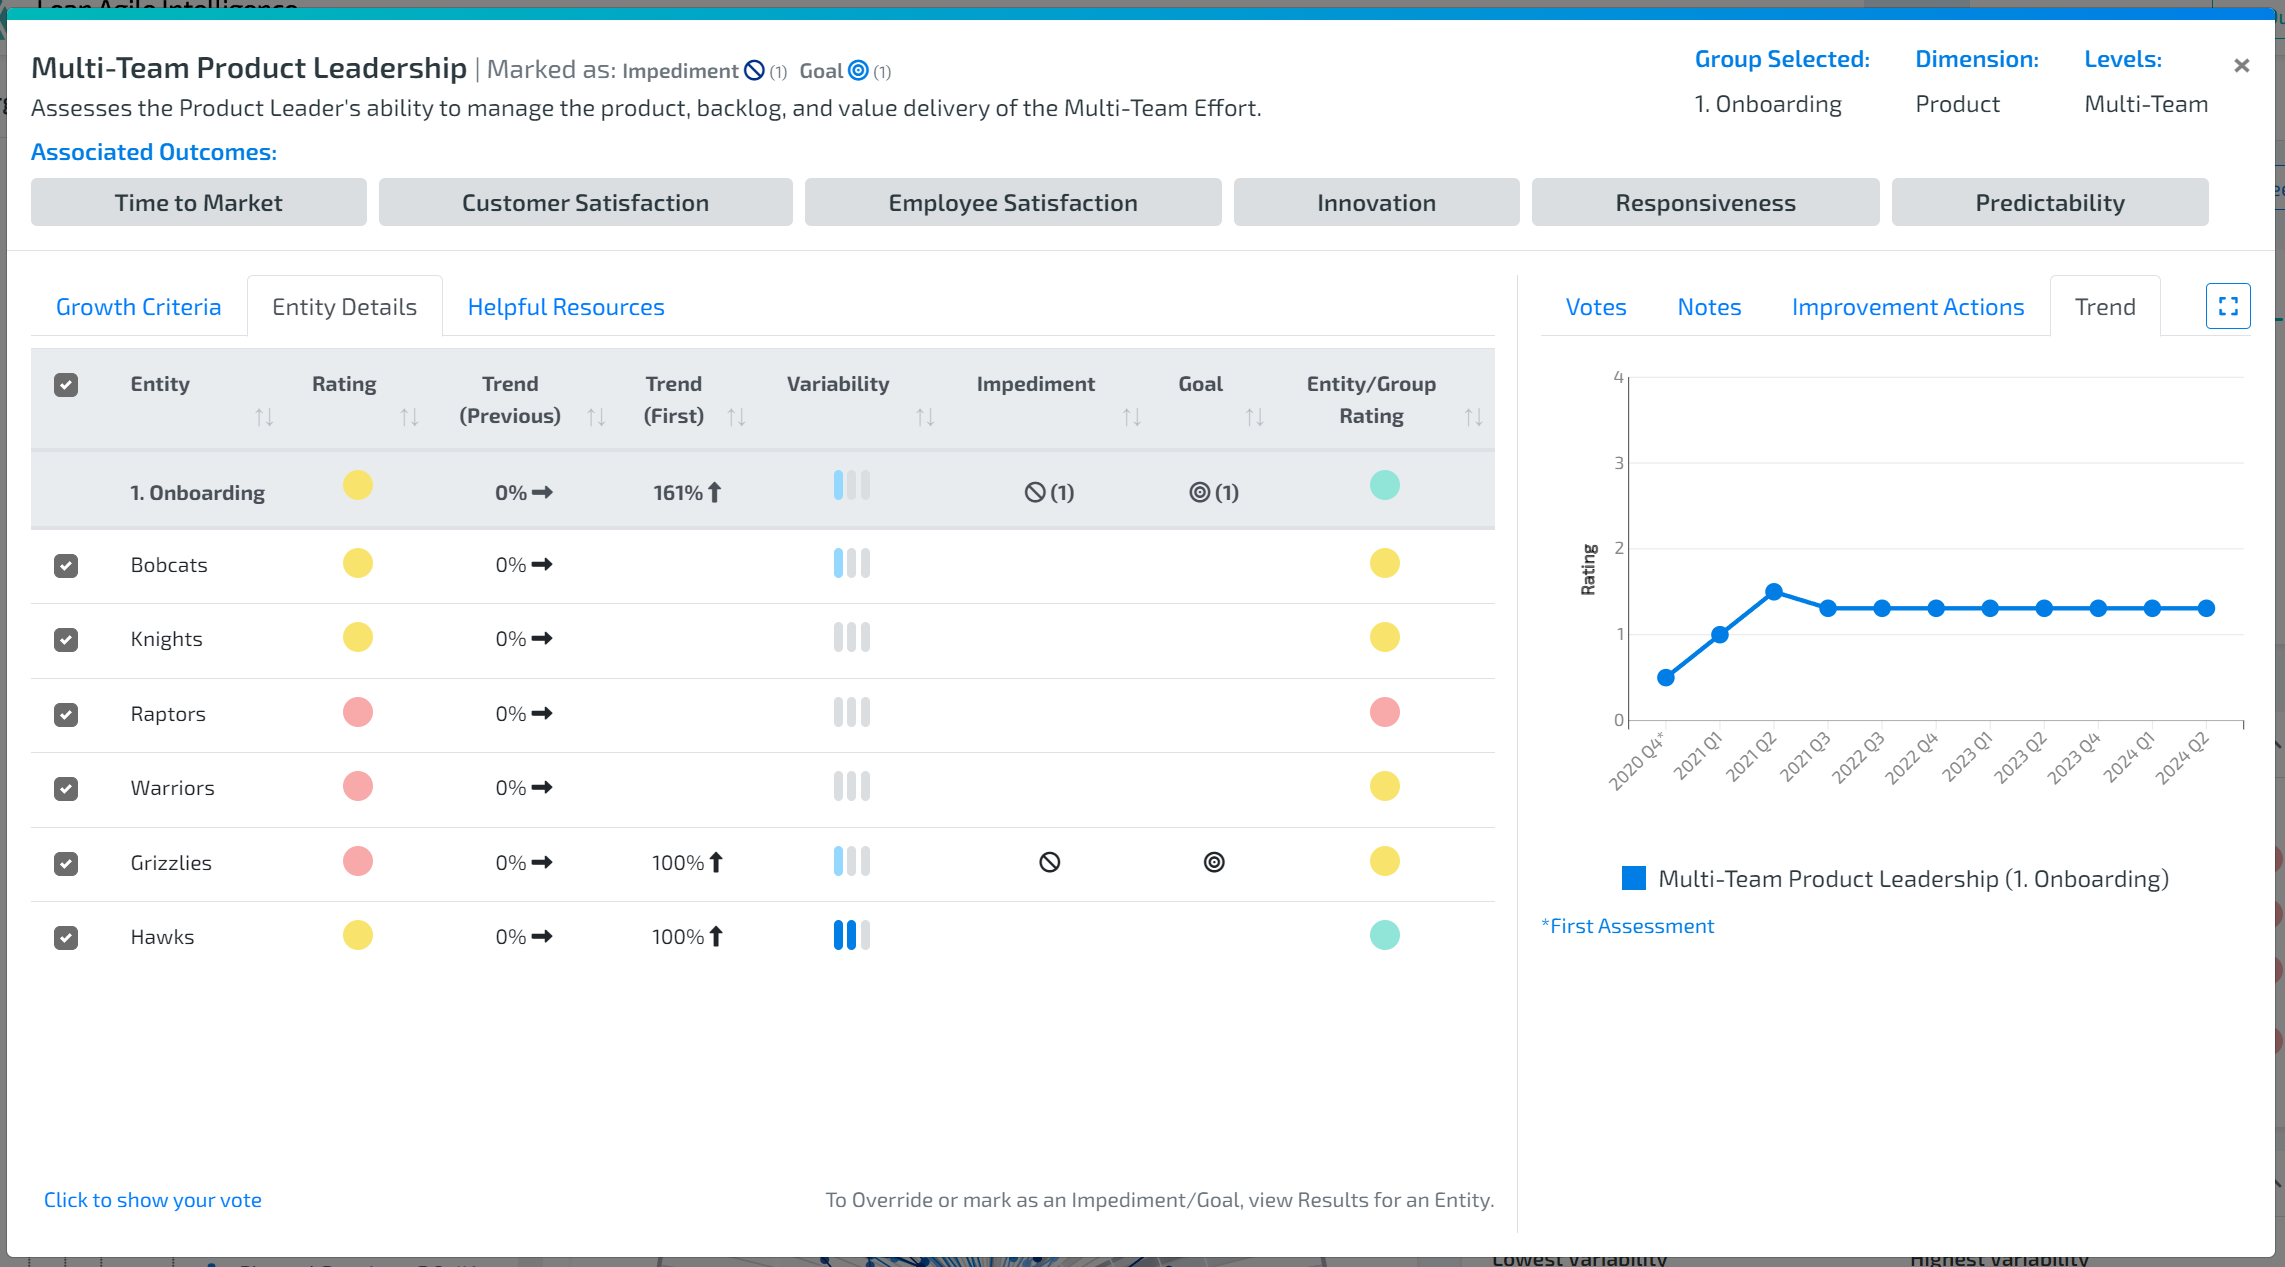
Gain deeper insights with our enhanced Capability Drilldown feature. You can now view trends based on specific capabilities, providing you with a more detailed understanding of performance over time.
Read more in our documentation here.
🛡️ GDPR Compliance
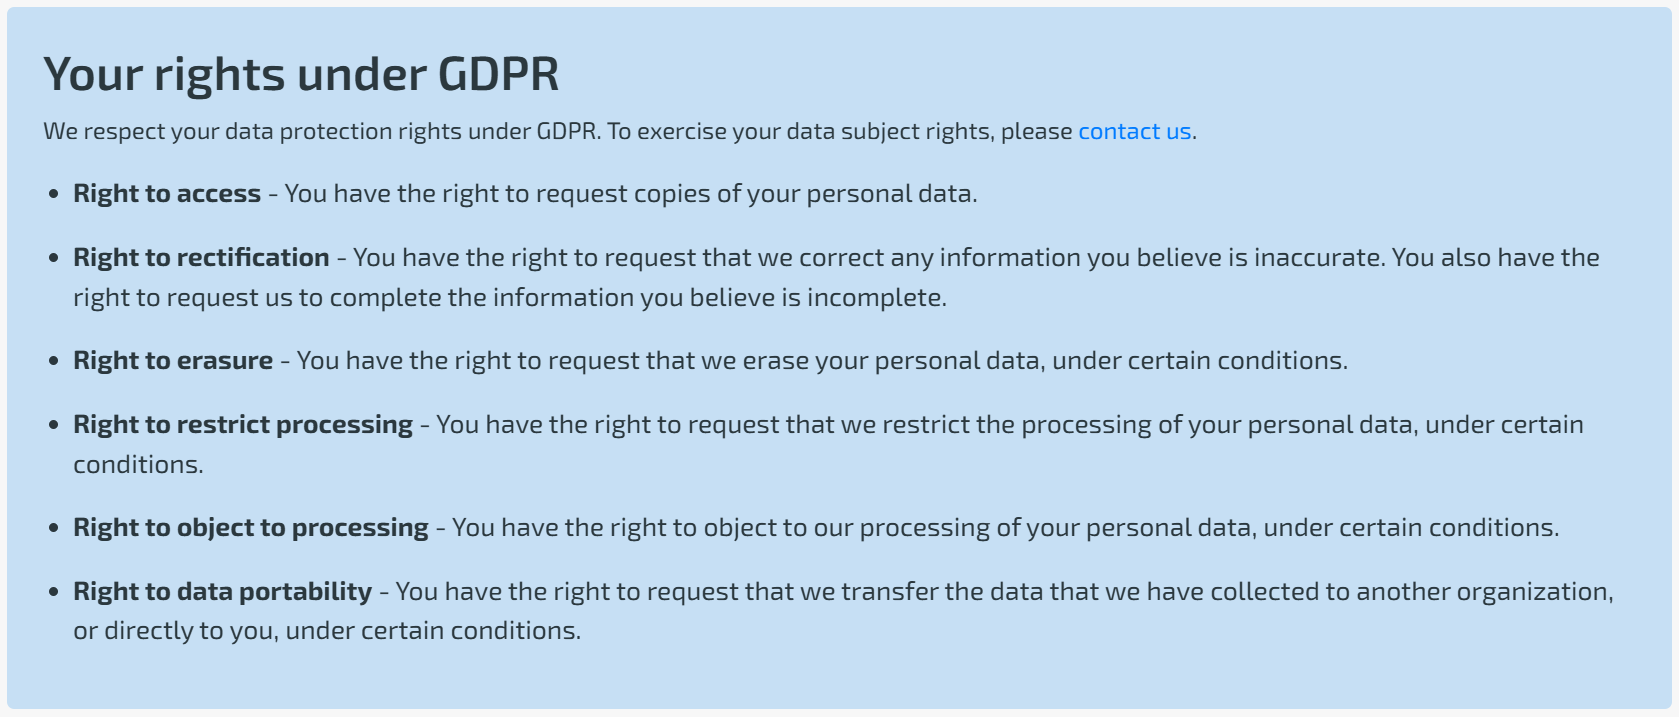
We are pleased to announce that our platform is now GDPR compliant. Your data security and privacy are of utmost importance to us, and this update ensures that your data is handled with the highest standards of protection.
Check out our GDPR Page here.
💌 Your Feedback Drives Us Forward & Other Updates:
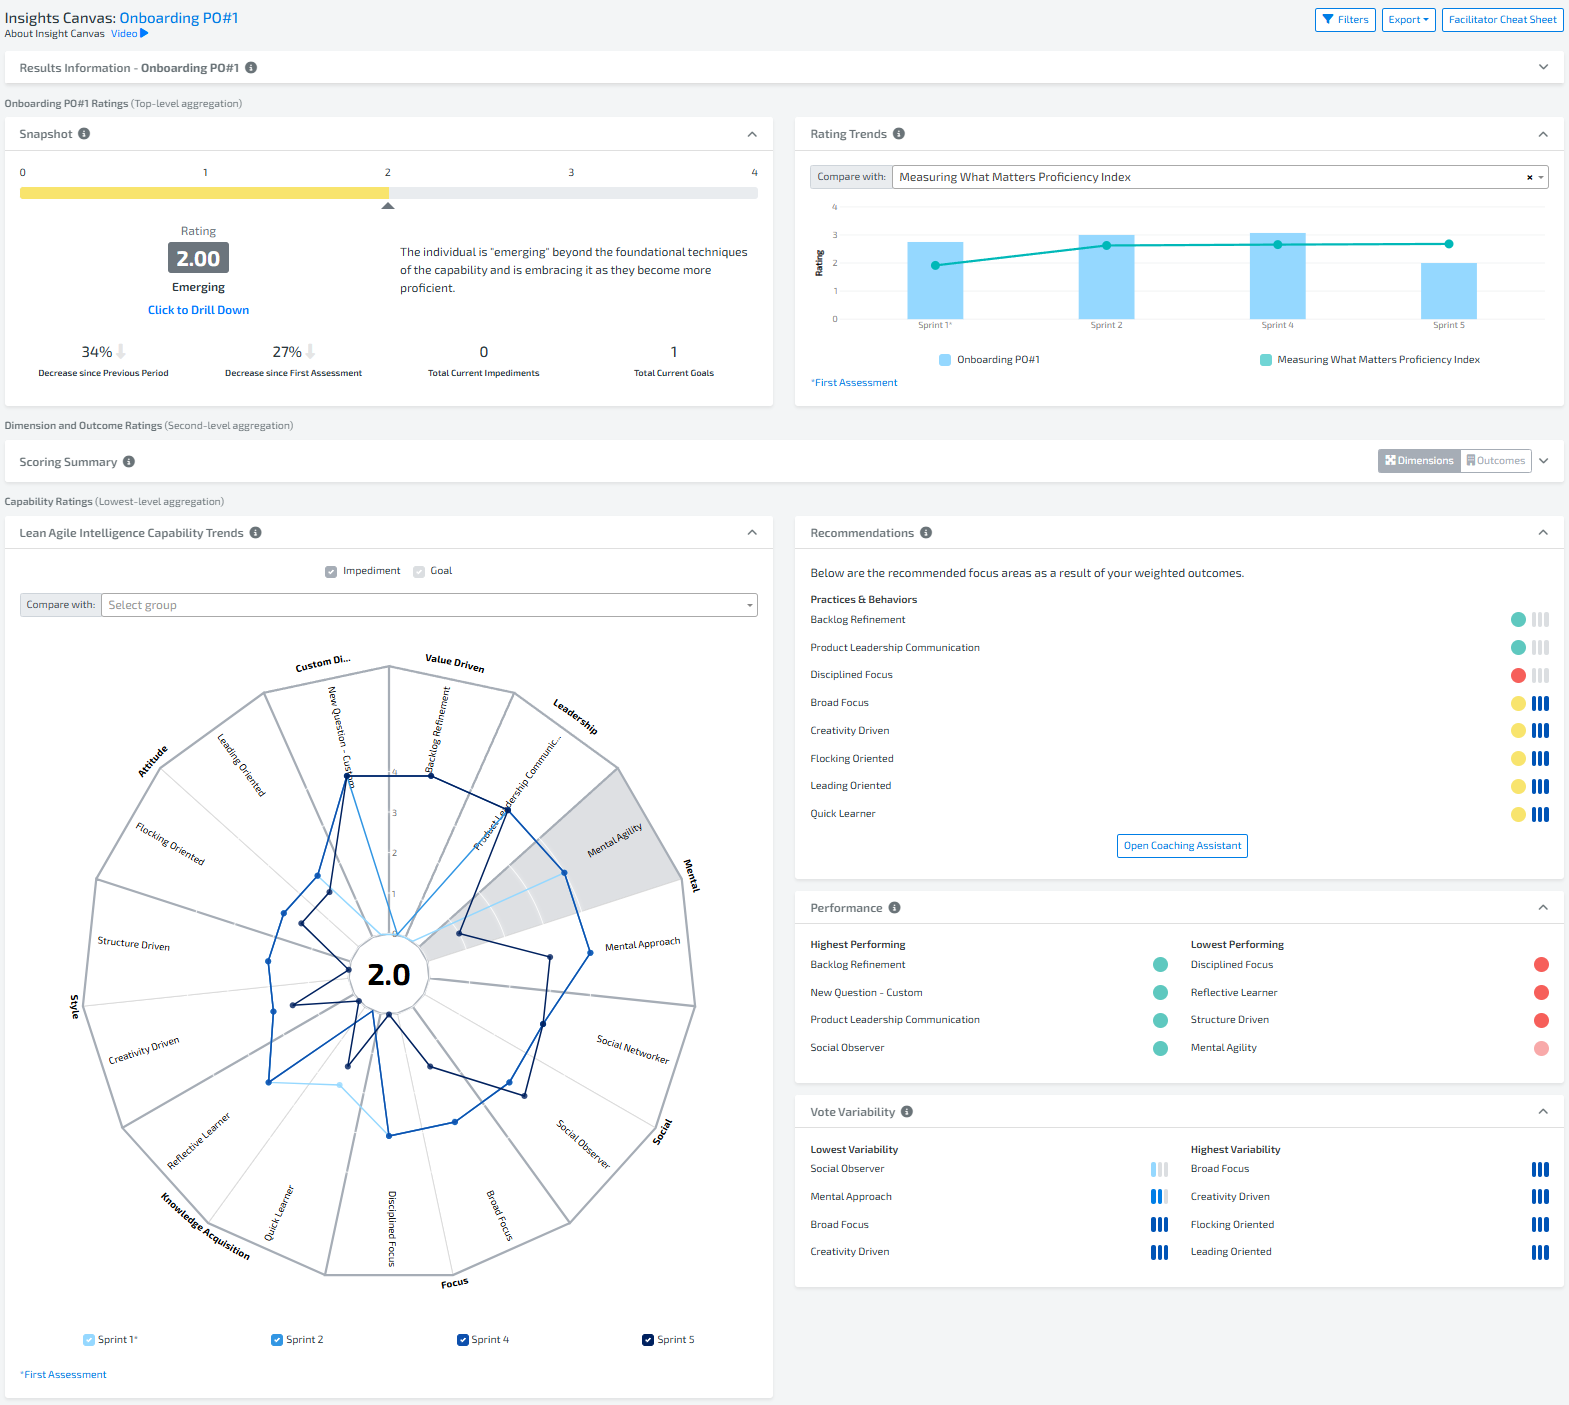
- Rating Trends Display: You can now view multiple trends in the Rating Trends widget. Hover information is designed to make the information clearer with the time period label and the rating score.
- Trends Display in Capability Trends Widget: If more than four trends are available, you can now select the trends that you want to display in the chart by choosing them from the dropdown next to the trend label.
These updates are part of our ongoing commitment to enhancing your experience and providing tools that are both insightful and practical. Explore these new features and see how they can benefit your organization. Your feedback is invaluable to us as we continue to innovate and improve our platform.
Stay tuned for more exciting updates to come! Join our monthly community newsletter here for a sneak peek.