A Clearer Insights Canvas, Side-by-Side Comparisons, and Organization-Wide Time Periods
By Team Lean Agile Intelligence
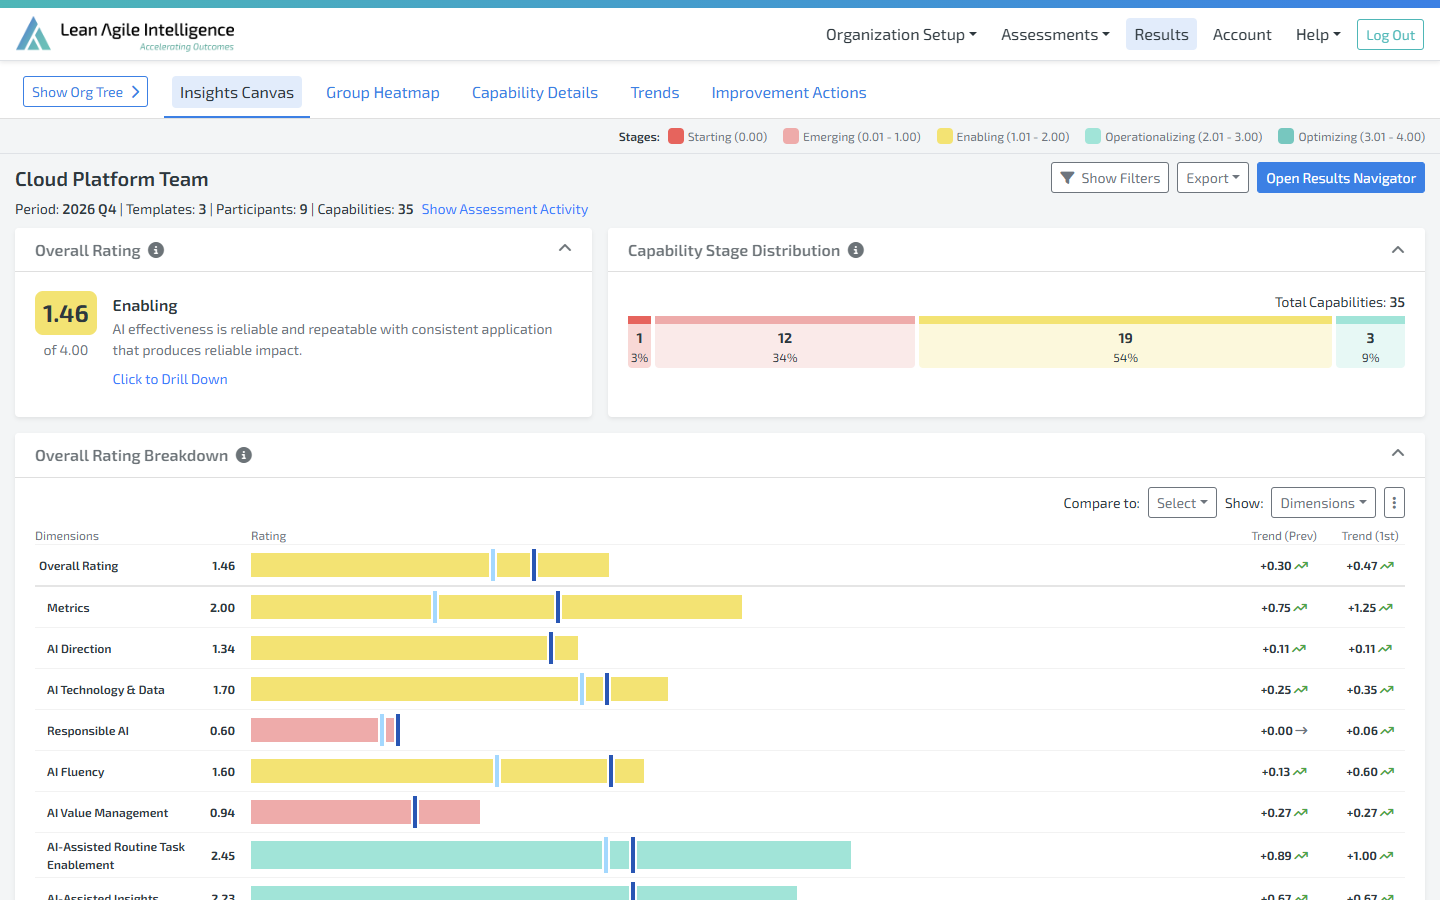
This release makes your Results quicker to read and easier to compare. The top of the Insights Canvas now tells you where you stand in a single glance. Comparisons show the difference for you instead of leaving you to work it out. And your whole Organization can now follow one time period sequence.
Alongside these, we have refreshed PDF exports, made Group-level variability a truer measure of agreement, and made Results load faster.
📊 A Clearer Start to the Insights Canvas
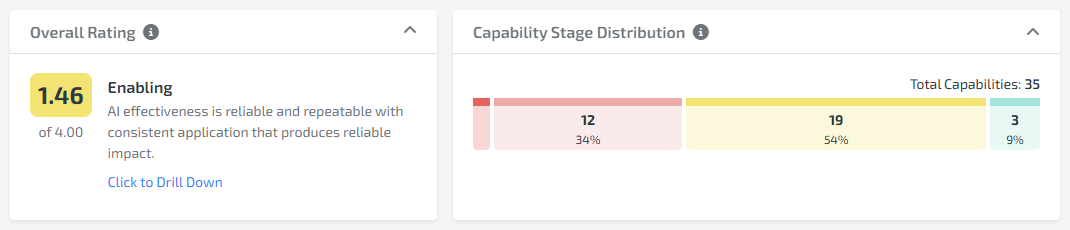
The Summary widget has been replaced by three focused widgets, so each answer has its own place:
- Overall Rating shows your aggregate average rating for the current period, the Stage it falls in and what that Stage means. Click through to drill down.
- Capability Stage Distribution is new. It shows how many of your assessed Capabilities sit in each Stage, from Starting to Optimizing, with the percentage of each.
- Improvement Activity brings together Total Impediments, Total Goals, and Open and Closed Improvement Actions (IAs).

Why it matters: an average alone can hide a lot. Two teams rated 2.0 can look very different. One has most Capabilities in the middle; the other has a split between Starting and Optimizing. Seeing the distribution next to the rating starts a better conversation about where to focus.
- Spot at a glance whether a rating comes from steady progress or a few standouts.
- Open a retrospective with the team's baseline in one view.
- Keep improvement commitments visible next to the results they came from.
Learn more about the Overall Rating, Capability Stage Distribution and Improvement Activity widgets here.
🔎 See the Difference When You Compare
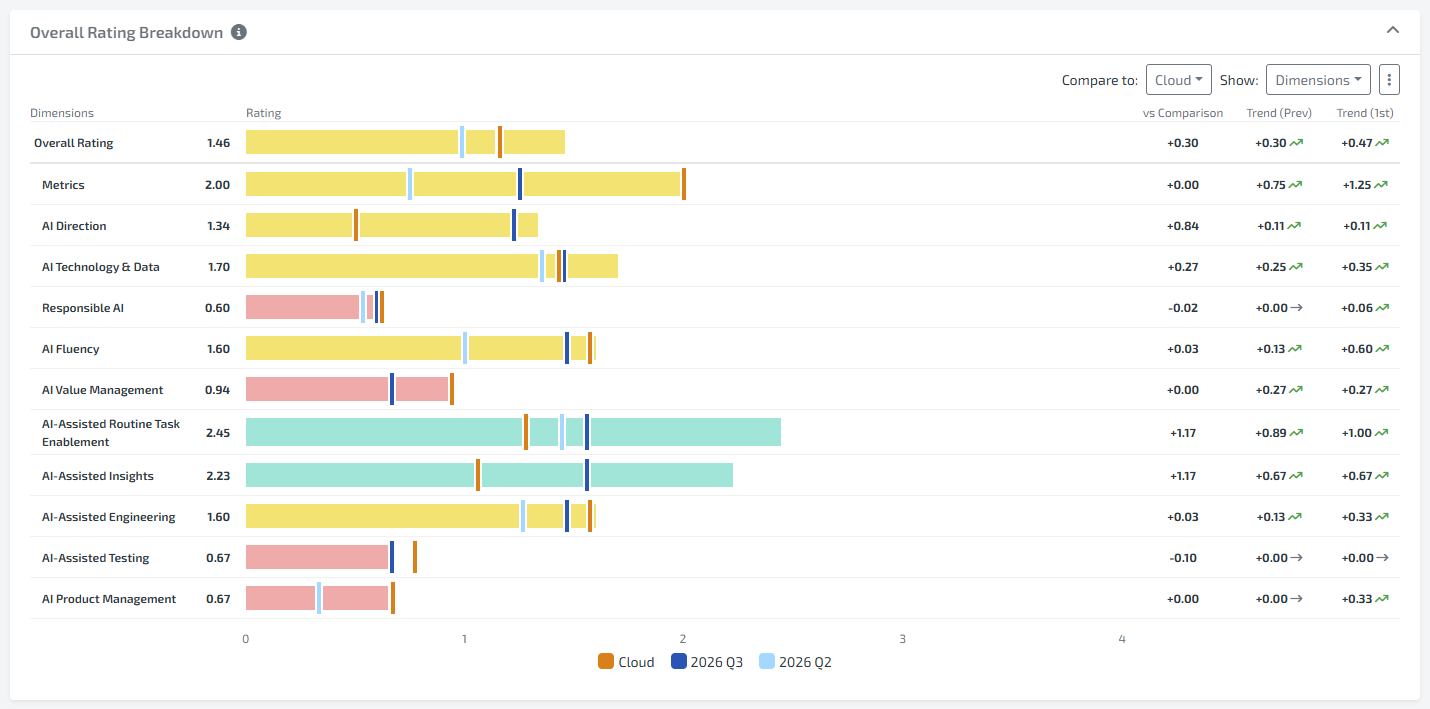
Comparing an Entity or Group with another Group or your Organization now shows the gap as a number, not just as two values side by side.
- Overall Rating Breakdown adds a vs Comparison column with the difference for each Dimension or Outcome.
- Capability Details adds the Compare to: dropdown, an overall difference, and a sortable column with the difference for each Capability.
- The Compare to: dropdown now works the same way on every widget that uses it.
Why it matters: sorting by difference brings the biggest gaps and the biggest strengths to the top, so you can see where a team leads or trails its peers in seconds.
- Find the Capabilities where a team differs most from its Group.
- Benchmark a Group against the Organization, Dimension by Dimension.
- Bring evidence to coaching conversations instead of impressions.
Learn more about Comparison Mode here.
🌳 One Time Period Sequence for Your Whole Organization
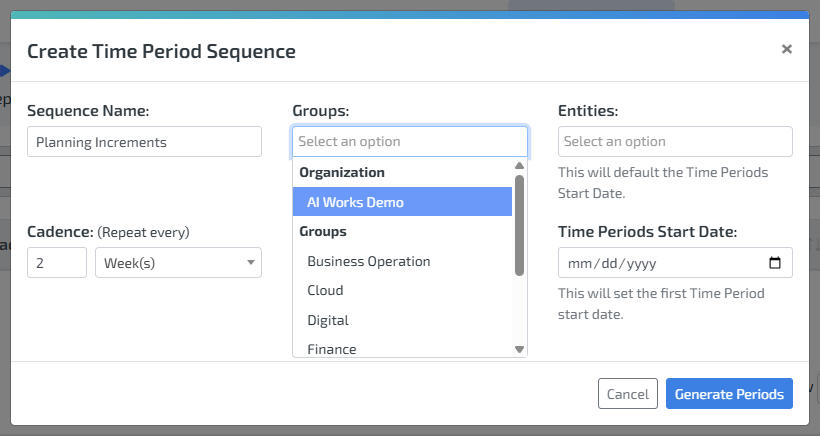
Custom Time Period Sequences can now be applied to the Organization, not just to Groups and Entities. Set your planning cadence once, and every level of your Results follows it, including Organization-level Results. Groups and Entities that need their own sequence keep it.
- Align Results with your quarters, program increments or planning cycles across the whole Organization.
- Stop assigning the same sequence Group by Group.
- Only Super Users with access to every Entity can change the Organization's sequence, so it stays under control.
Learn more about Custom Time Periods here.
✨ Additional Improvements
This release also includes several smaller enhancements:
- ⚖️ Truer Group Variability: Group and Organization variability is now the average of each Entity's own variability, weighted by responses. It reflects how much each team agrees internally, rather than how far apart different teams are.
- 📄 Refreshed PDF Exports: Choose the new widgets when exporting, get a cleaner header with the template and export time, and get file names that start with "LAI-" and end with the date.
- 🏷️ Template at a Glance: Entity Results now show which template the results come from, right under the Entity name.
- 🔍 Updated Capability Drilldown Layout: The Capability Drilldown has a refreshed layout that matches the new Insights Canvas.
- 🔗 Helpful Resources for AI Capabilities: AI team assessment Capabilities now link to related Helpful Resources.
- ⚡ Faster Results: Results dashboards load and export faster.
- 🛠️ Fixes: The AI Comment Summarizer no longer saves empty summaries, and the Results Disclosure table in Assessment Activity displays correctly.
This release is about clarity and context. Facilitators get a sharper starting point for every results review. Analysts and coaches can see exactly where teams differ. Administrators can line up the whole Organization on one cadence.
Stay tuned for more updates, and thank you for being part of the Lean Agile Intelligence community.